
Posted On
Sussex County is the 4th largest county in New Jersey according to land area and consists of 24 municipalities.
Sussex County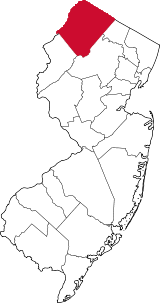
Facts and Figures from the NJ Data Book
Area
519 square miles
Density
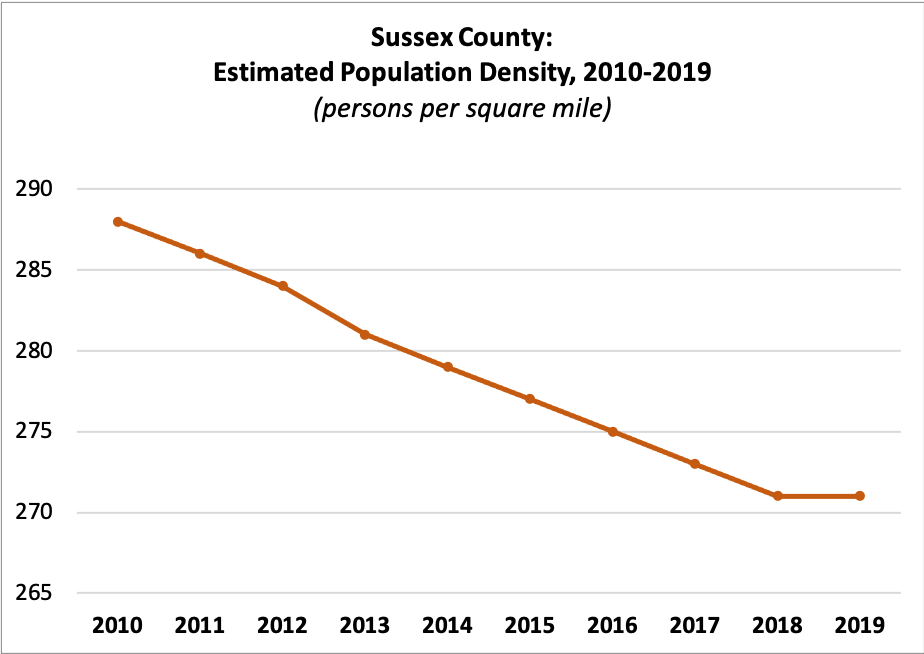
| 2010 | 288 |
| 2011 | 286 |
| 2012 | 284 |
| 2013 | 281 |
| 2014 | 279 |
| 2015 | 277 |
| 2016 | 275 |
| 2017 | 273 |
| 2018 | 271 |
| 2019 | 271 |
Census Population
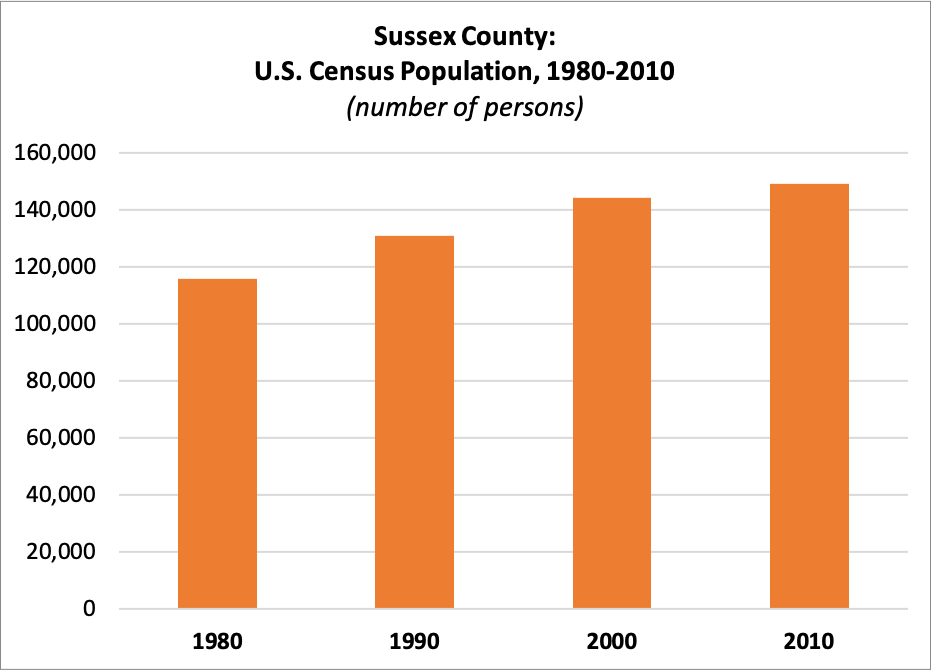
| 1980 | 115,919 |
| 1990 | 130,943 |
| 2000 | 144,166 |
| 2010 | 149,265 |
Estimated Population
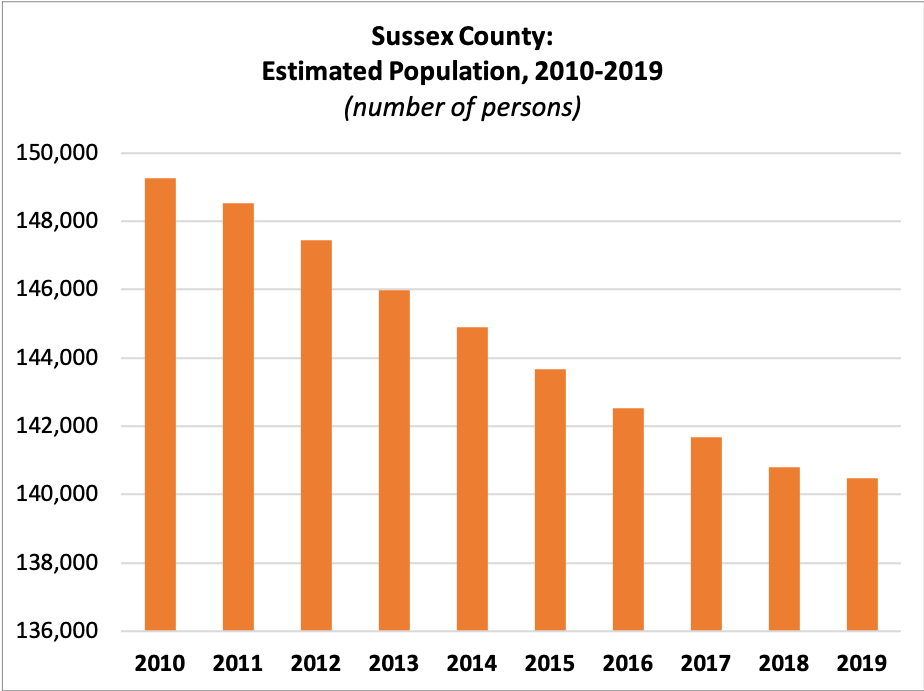
| 2010 | 149,265 |
| 2011 | 148,517 |
| 2012 | 147,442 |
| 2013 | 145,992 |
| 2014 | 144,909 |
| 2015 | 143,673 |
| 2016 | 142,522 |
| 2017 | 141,682 |
| 2018 | 140,799 |
| 2019 | 140,488 |
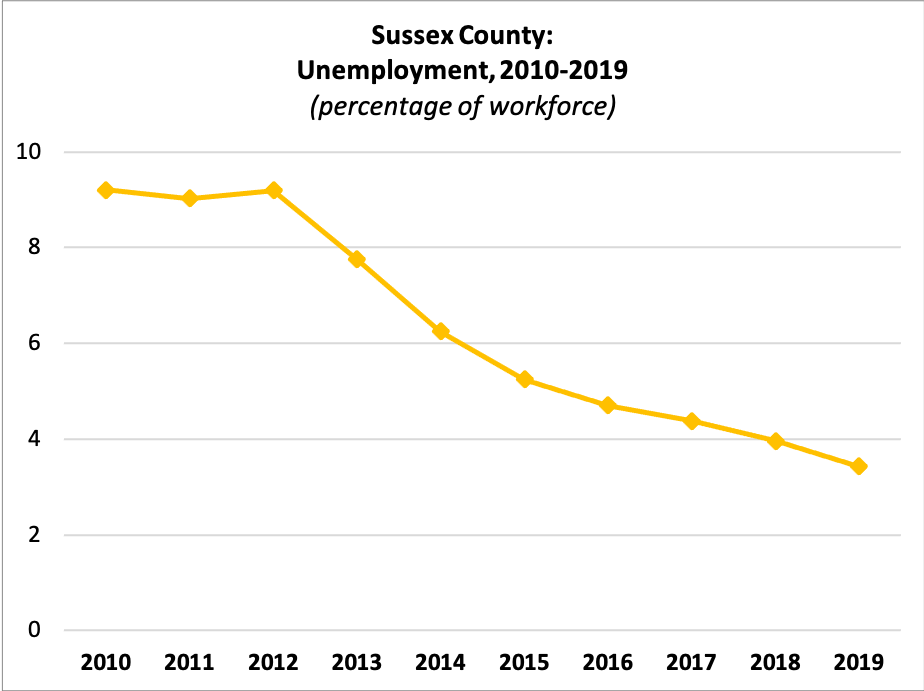
Unemployment
 Workforce:
| 2010 | 82,050 |
| 2011 | 81,617 |
| 2012 | 83,666 |
| 2013 | 80,893 |
| 2014 | 78,651 |
| 2015 | 77,575 |
| 2016 | 75,959 |
| 2017 | 75,281 |
| 2018 | 72,559 |
| 2019 | 73,966 |
Percent Unemployed:
| 2010 | 9.20% |
| 2011 | 9.02% |
| 2012 | 9.19% |
| 2013 | 7.75% |
| 2014 | 6.25% |
| 2015 | 5.24% |
| 2016 | 4.70% |
| 2017 | 4.38% |
| 2018 | 3.96% |
| 2019 | 3.43% |
Median Rent
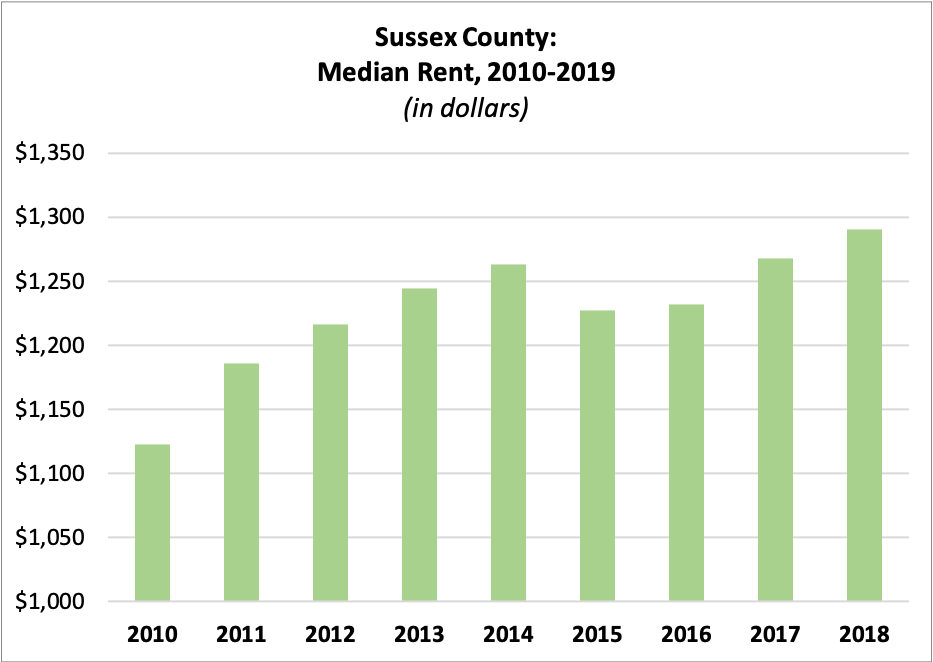
| 2010 | $1,122.48 |
| 2011 | $1,186.02 |
| 2012 | $1,216.47 |
| 2013 | $1,244.56 |
| 2014 | $1,262.93 |
| 2015 | $1,227.56 |
| 2016 | $1,232.21 |
| 2017 | $1,268.36 |
| 2018 | $1,291.01 |
Average Residential Property Value
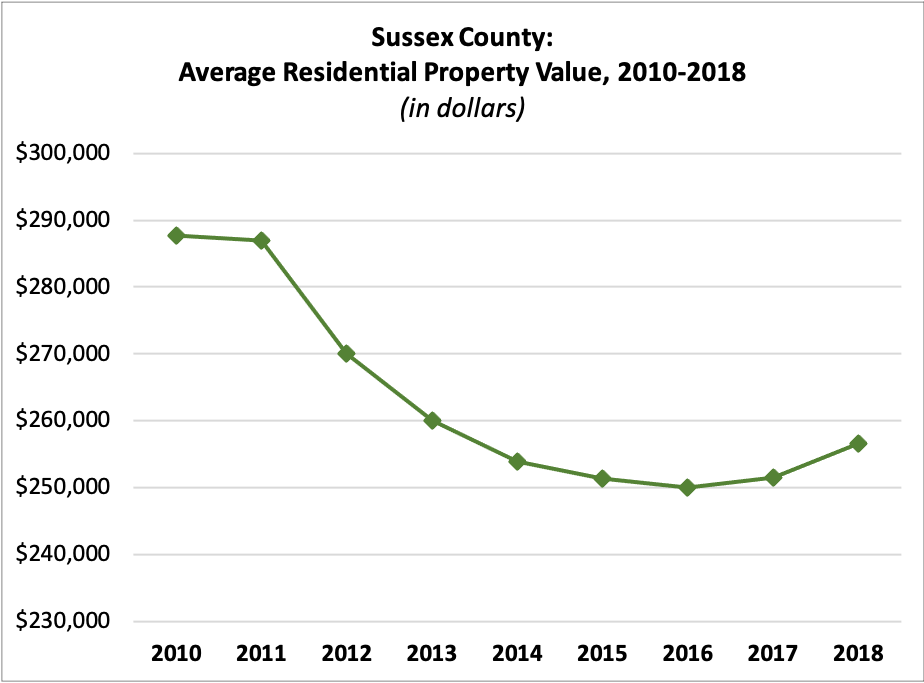
| 2010 | $287,744.67 |
| 2011 | $287,022.24 |
| 2012 | $270,045.72 |
| 2013 | $260,019.00 |
| 2014 | $253,823.65 |
| 2015 | $251,361.51 |
| 2016 | $249,966.55 |
| 2017 | $251,475.94 |
| 2018 | $256,553.09 |
Income per Taxpayer
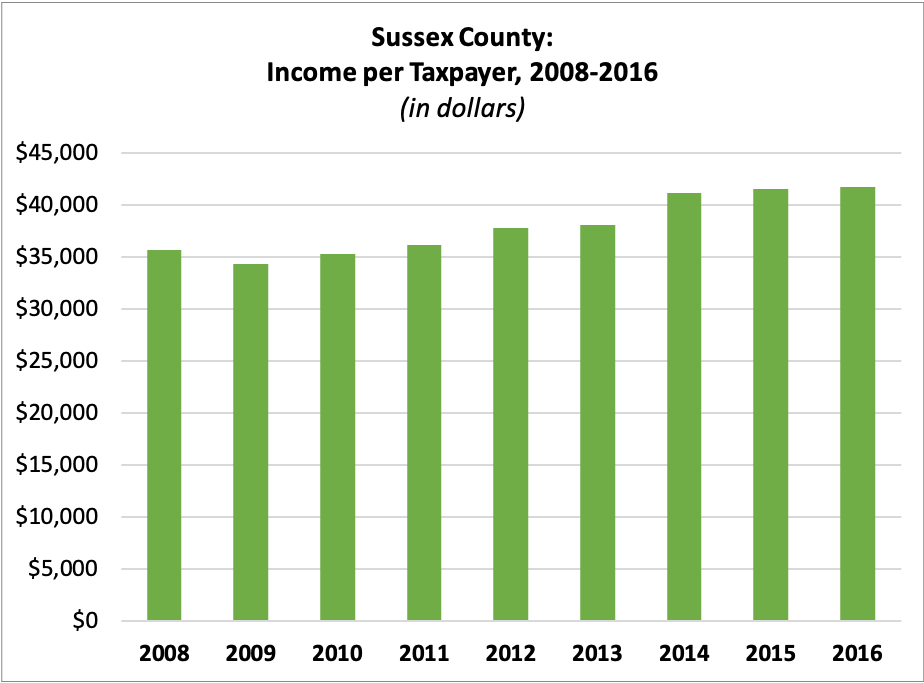
| 2008 | $35,713.28 |
| 2009 | $34,347.53 |
| 2010 | $35,279.26 |
| 2011 | $36,221.22 |
| 2012 | $37,803.70 |
| 2013 | $38,087.20 |
| 2014 | $41,225.99 |
| 2015 | $41,524.99 |
| 2016 | $41,788.16 |
Registered Voters
 Number of Registered Voters
| 2010 | 97,568 |
| 2011 | 98,935 |
| 2012 | 100,152 |
| 2013 | 101,136 |
| 2014 | 101,946 |
| 2015 | 98,235 |
| 2016 | 103,839 |
| 2017 | 103,881 |
| 2018 | 106,335 |
| 2019 | 107,495 |
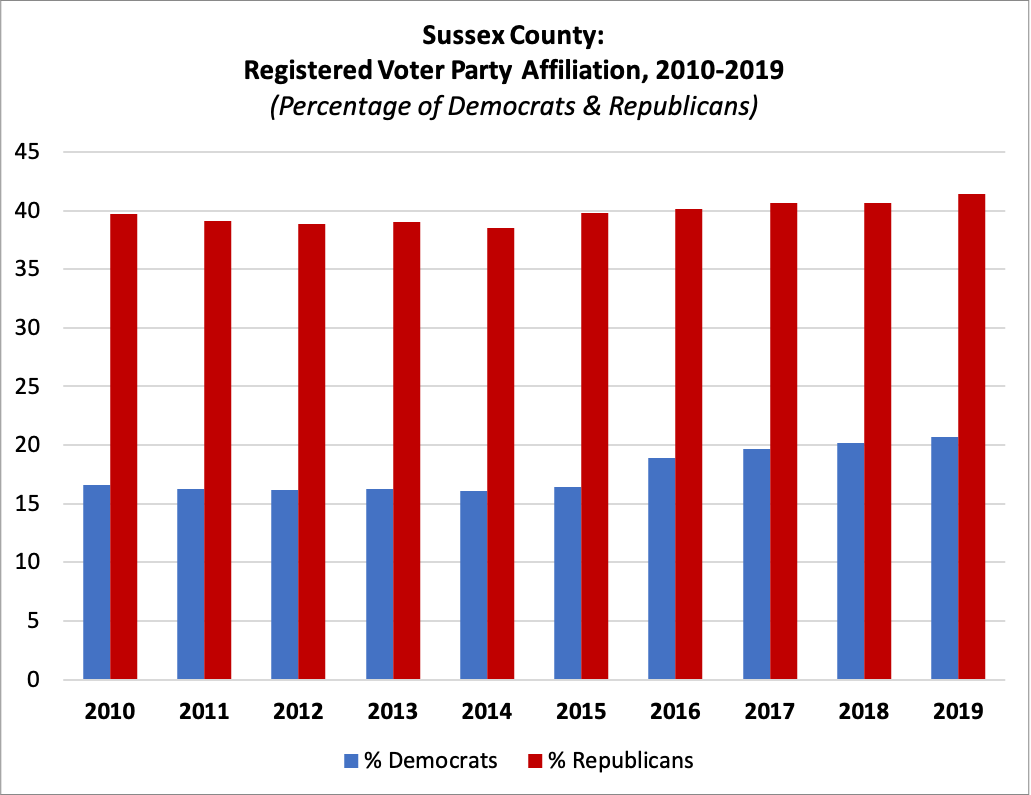
Percent Registered as Democrats
| 2010 | 16.63% |
| 2011 | 16.29% |
| 2012 | 16.13% |
| 2013 | 16.27% |
| 2014 | 16.09% |
| 2015 | 16.39% |
| 2016 | 18.93% |
| 2017 | 19.71% |
| 2018 | 20.19% |
| 2019 | 20.73% |
Percent Registered as Republicans
| 2010 | 39.68% |
| 2011 | 39.13% |
| 2012 | 38.84% |
| 2013 | 39.02% |
| 2014 | 38.48% |
| 2015 | 39.76% |
| 2016 | 40.15% |
| 2017 | 40.69% |
| 2018 | 40.68% |
| 2019 | 41.40% |
For this and more data, visit njdatabook.rutgers.edu!