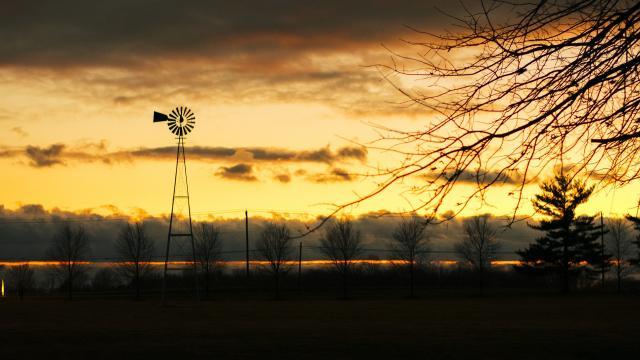
Located on the western edge of South Jersey, Salem County consists of 15 municipalities and ranks 10th in size compared to other counties. The first Quaker colony in America settled on what later became the county in 1675. [1] The word “Salem” means “peace” and the county has a reputation for being a peaceful place.
Salem County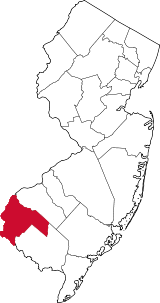
Facts and Figures from the NJ Data Book
Area
331.88 square miles
Density
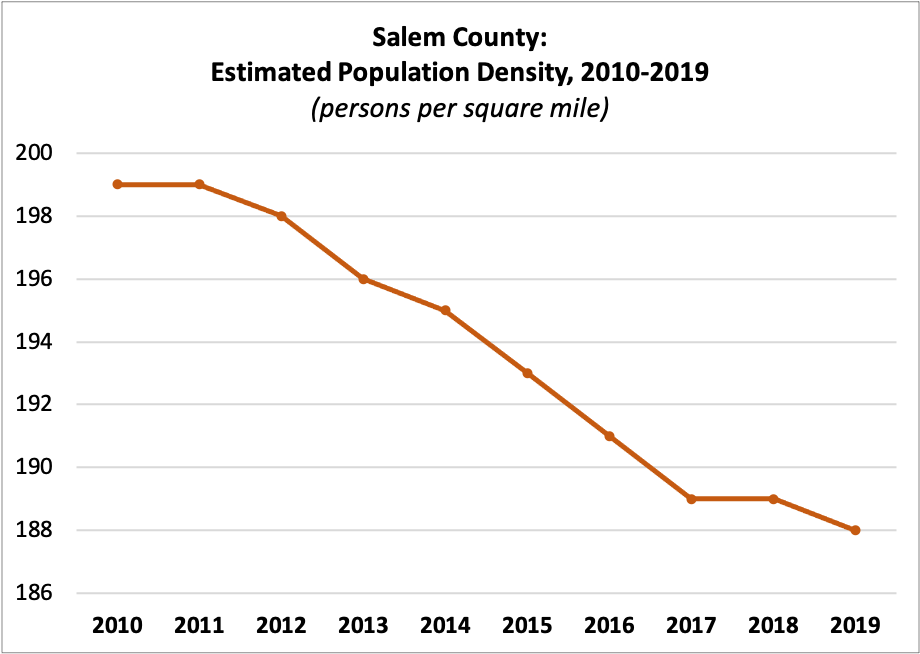
| 2010 | 199 |
| 2011 | 199 |
| 2012 | 198 |
| 2013 | 196 |
| 2014 | 195 |
| 2015 | 193 |
| 2016 | 191 |
| 2017 | 189 |
| 2018 | 189 |
| 2019 | 188 |
Census Population
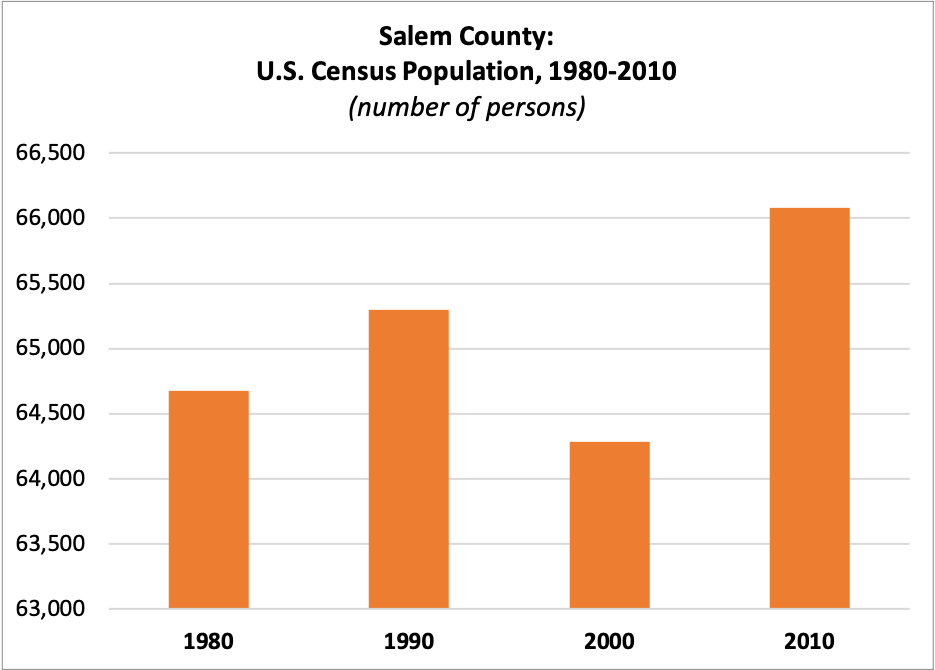
| 1980 | 64,676 |
| 1990 | 65,294 |
| 2000 | 64,285 |
| 2010 | 66,083 |
Estimated Population
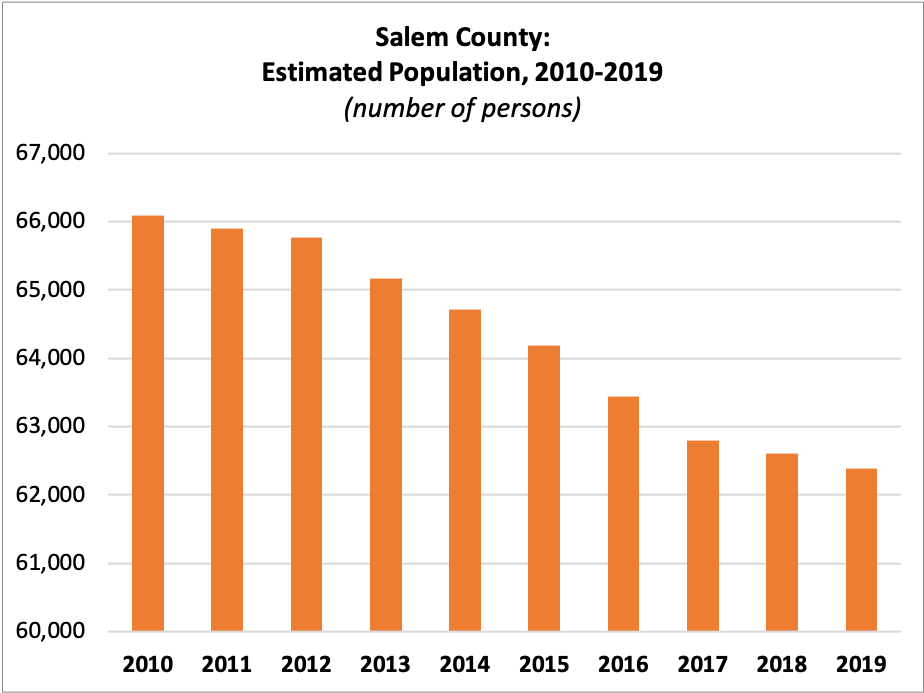
| 2010 | 66,083 |
| 2011 | 65,902 |
| 2012 | 65,774 |
| 2013 | 65,166 |
| 2014 | 64,715 |
| 2015 | 64,180 |
| 2016 | 63,436 |
| 2017 | 62,792 |
| 2018 | 62,607 |
| 2019 | 62,385 |
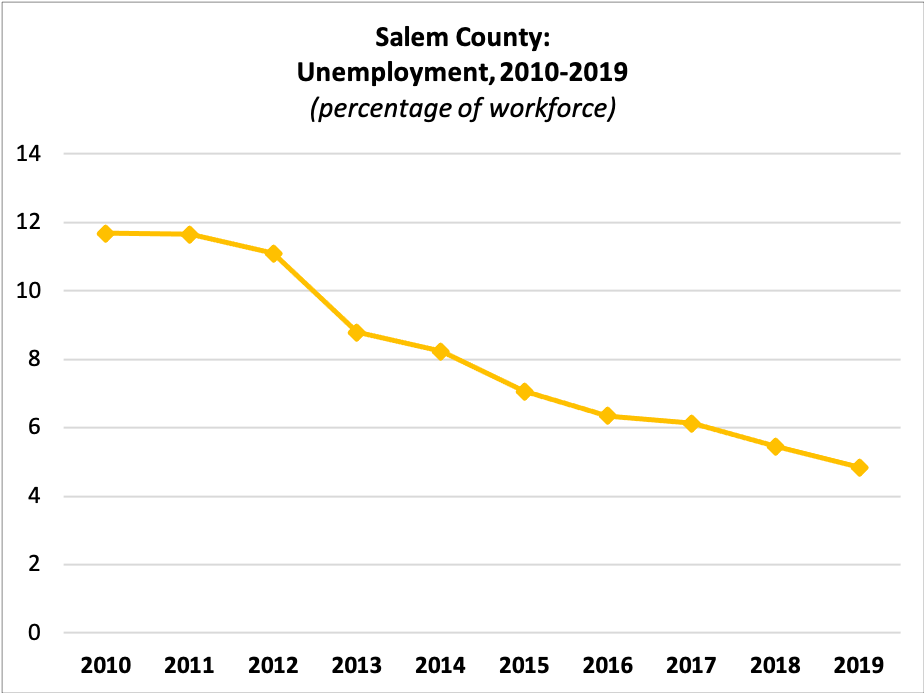
Unemployment
 Workforce:
| 2010 | 32,100 |
| 2011 | 32,376 |
| 2012 | 31,512 |
| 2013 | 30,811 |
| 2014 | 31,427 |
| 2015 | 31,443 |
| 2016 | 30,618 |
| 2017 | 29,890 |
| 2018 | 28,795 |
| 2019 | 29,183 |
Percent Unemployed:
| 2010 | 11.67% |
| 2011 | 11.65% |
| 2012 | 11.09% |
| 2013 | 8.78% |
| 2014 | 8.23% |
| 2015 | 7.06% |
| 2016 | 6.35% |
| 2017 | 6.12% |
| 2018 | 5.45% |
| 2019 | 4.84% |
Median Rent
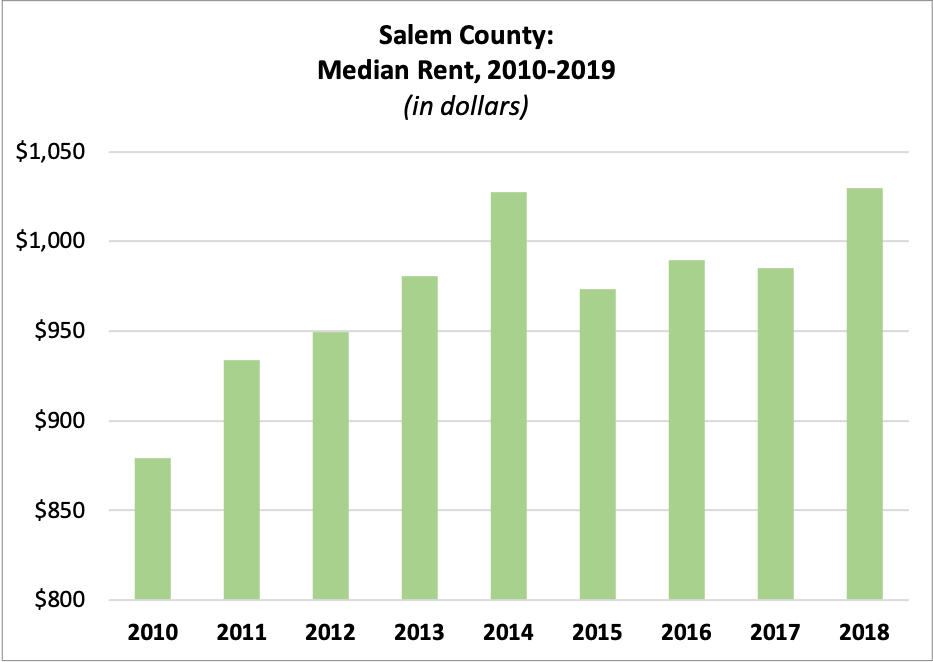
| 2010 | $879.45 |
| 2011 | $933.68 |
| 2012 | $949.16 |
| 2013 | $980.66 |
| 2014 | $1,027.53 |
| 2015 | $973.56 |
| 2016 | $989.71 |
| 2017 | $984.90 |
| 2018 | $1,029.45 |
Average Residential Property Value
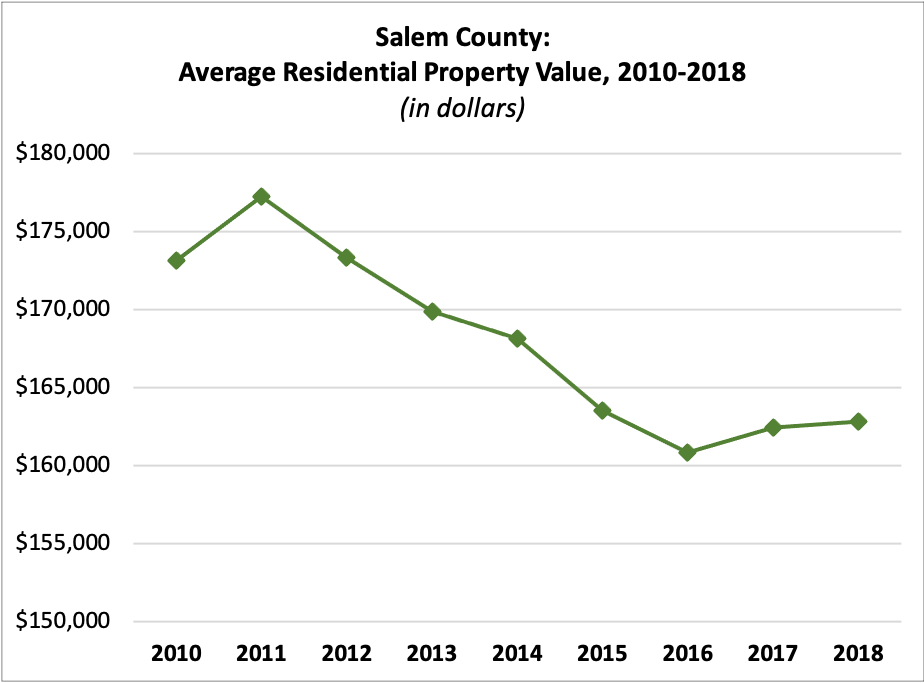
| 2010 | $173,122.15 |
| 2011 | $177,236.77 |
| 2012 | $173,334.01 |
| 2013 | $169,886.28 |
| 2014 | $168,150.73 |
| 2015 | $163,489.99 |
| 2016 | $160,826.64 |
| 2017 | $162,407.70 |
| 2018 | $162,806.52 |
Income per Taxpayer
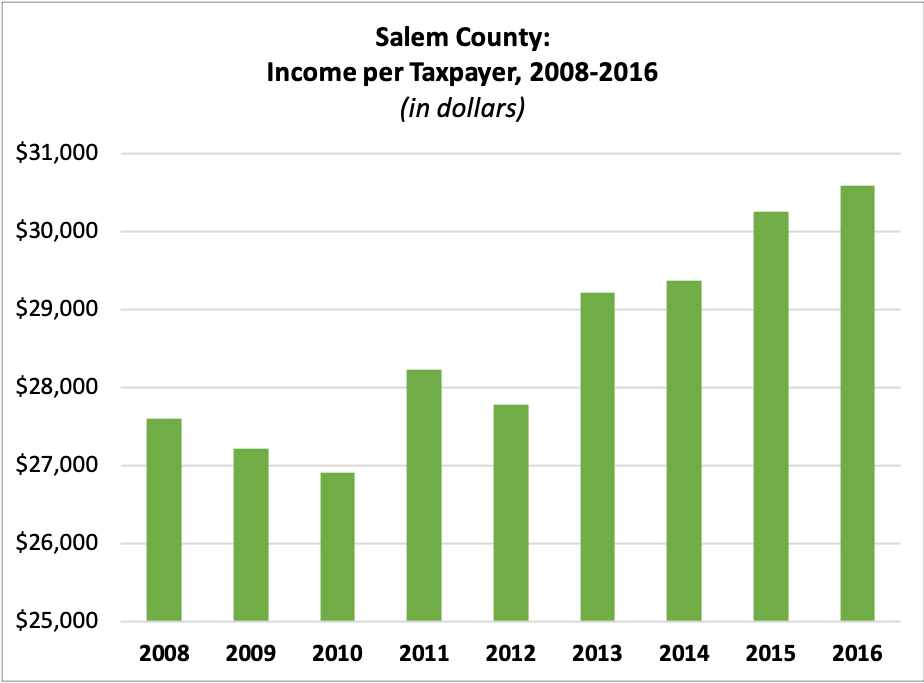
| 2008 | $27,603.48 |
| 2009 | $27,213.06 |
| 2010 | $26,907.90 |
| 2011 | $28,225.09 |
| 2012 | $27,777.48 |
| 2013 | $29,209.85 |
| 2014 | $29,373.71 |
| 2015 | $30,253.23 |
| 2016 | $30,580.18 |
Registered Voters
 Number of Registered Voters
| 2010 | 41,006 |
| 2011 | 43,058 |
| 2012 | 44,509 |
| 2013 | 43,915 |
| 2014 | 44,098 |
| 2015 | 43,030 |
| 2016 | 44,748 |
| 2017 | 41,522 |
| 2018 | 44,766 |
| 2019 | 42,207 |
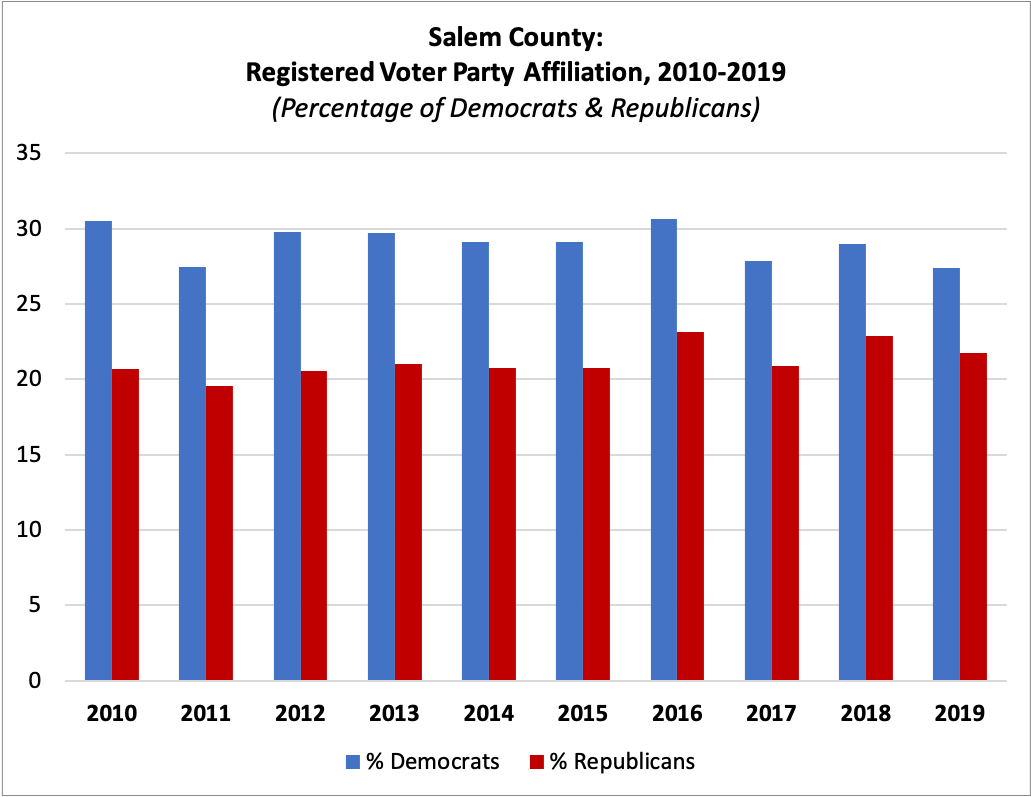
Percent Registered as Democrats
| 2010 | 30.48% |
| 2011 | 27.46% |
| 2012 | 29.78% |
| 2013 | 29.68% |
| 2014 | 29.12% |
| 2015 | 29.09% |
| 2016 | 30.65% |
| 2017 | 27.86% |
| 2018 | 28.96% |
| 2019 | 27.41% |
Percent Registered as Republicans
| 2010 | 20.67% |
| 2011 | 19.54% |
| 2012 | 20.58% |
| 2013 | 21.04% |
| 2014 | 20.73% |
| 2015 | 20.76% |
| 2016 | 23.16% |
| 2017 | 20.90% |
| 2018 | 22.89% |
| 2019 | 21.73% |
For this and more data, visit njdatabook.rutgers.edu!
References
1. About Salem County. Salem County, NJ Official Website. Retrieved from https://www.salemcountynj.gov/about-salem-county/.