
Passaic County was founded in 1837 and ranks 18th in size compared to other counties. It is made up of 16 municipalities. Among its many notable residents, past and present, are actors Paul Rudd and Zoe Saldana, as well as TV producer Sherwood Schwartz, best known for creating Gilligan's Island and The Brady Bunch! [1]
Passaic County
Facts and Figures from the NJ Data Book
Area
184.58 square miles
Density

| 2010 | 2,715 |
| 2011 | 2,720 |
| 2012 | 2,724 |
| 2013 | 2,740 |
| 2014 | 2,757 |
| 2015 | 2,768 |
| 2016 | 2,752 |
| 2017 | 2,777 |
| 2018 | 2,727 |
| 2019 | 2,719 |
Census Population
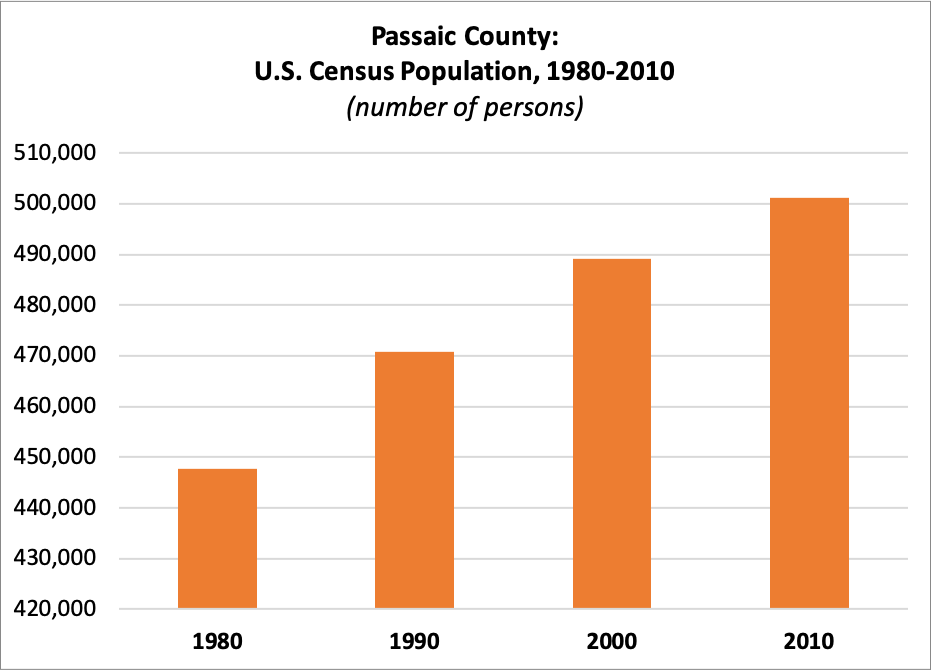
| 1980 | 447,585 |
| 1990 | 470,864 |
| 2000 | 489,049 |
| 2010 | 501,226 |
Estimated Population
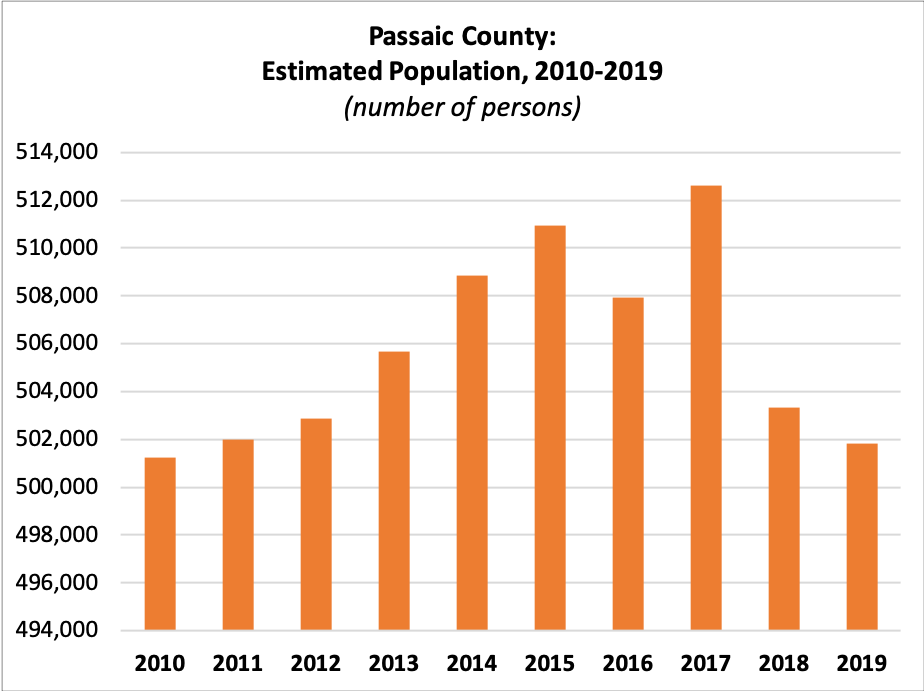
| 2010 | 501,226 |
| 2011 | 502,007 |
| 2012 | 502,885 |
| 2013 | 505,672 |
| 2014 | 508,856 |
| 2015 | 510,916 |
| 2016 | 507,945 |
| 2017 | 512,607 |
| 2018 | 503,310 |
| 2019 | 501,826 |
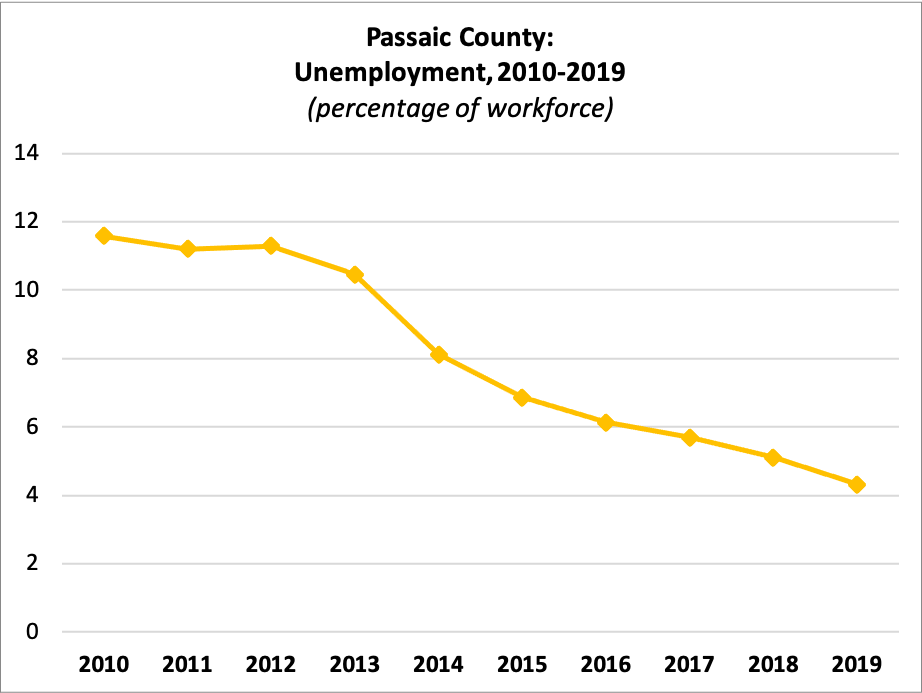
Unemployment
 Workforce:
| 2010 | 254,561 |
| 2011 | 256,113 |
| 2012 | 246,821 |
| 2013 | 240,418 |
| 2014 | 248,427 |
| 2015 | 249,647 |
| 2016 | 247,823 |
| 2017 | 245,449 |
| 2018 | 239,204 |
| 2019 | 242,208 |
Percent Unemployed:
| 2010 | 11.58% |
| 2011 | 11.20% |
| 2012 | 11.29% |
| 2013 | 10.46% |
| 2014 | 8.12% |
| 2015 | 6.86% |
| 2016 | 6.13% |
| 2017 | 5.69% |
| 2018 | 5.10% |
| 2019 | 4.31% |
Median Rent
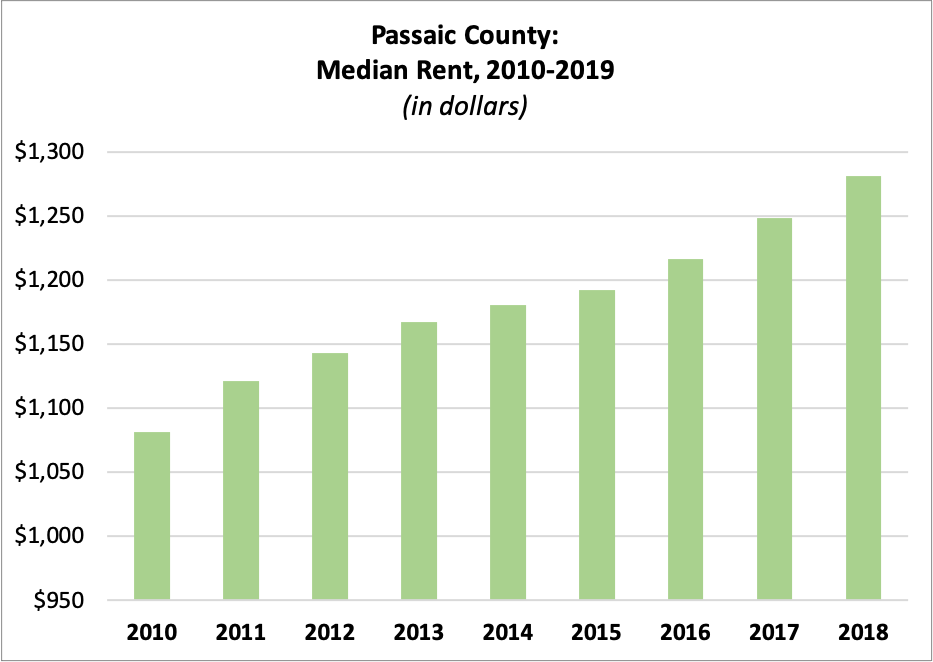
| 2010 | $1,081.72 |
| 2011 | $1,121.48 |
| 2012 | $1,142.99 |
| 2013 | $1,167.22 |
| 2014 | $1,180.68 |
| 2015 | $1,192.29 |
| 2016 | $1,216.64 |
| 2017 | $1,248.01 |
| 2018 | $1,281.12 |
Average Residential Property Value
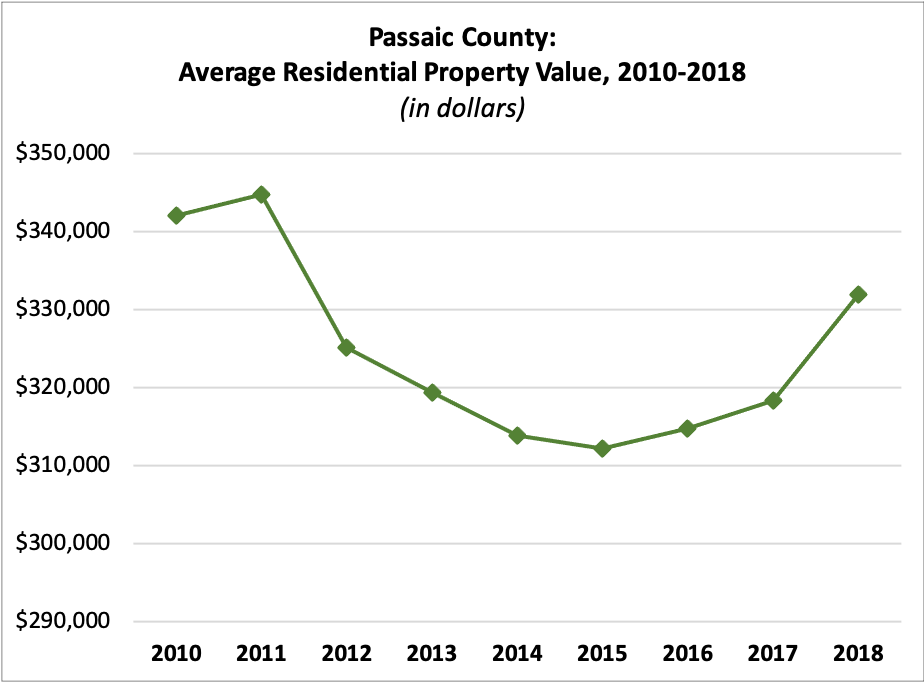
| 2010 | $341,968.38 |
| 2011 | $344,770.39 |
| 2012 | $325,051.78 |
| 2013 | $319,306.27 |
| 2014 | $313,818.46 |
| 2015 | $312,124.56 |
| 2016 | $314,646.54 |
| 2017 | $318,269.92 |
| 2018 | $331,944.84 |
Income per Taxpayer
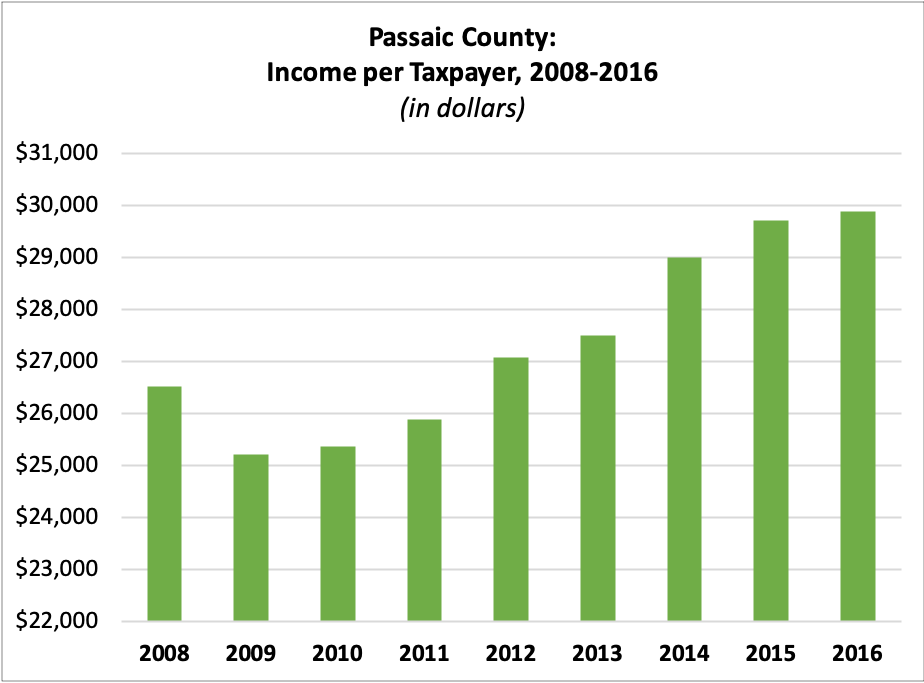
| 2008 | $26,506.91 |
| 2009 | $25,200.31 |
| 2010 | $25,358.27 |
| 2011 | $25,872.03 |
| 2012 | $27,067.27 |
| 2013 | $27,486.97 |
| 2014 | $28,998.03 |
| 2015 | $29,702.69 |
| 2016 | $29,890.19 |
Registered Voters
 Number of Registered Voters
| 2010 | 266,264 |
| 2011 | 269,084 |
| 2012 | 290,424 |
| 2013 | 296,587 |
| 2014 | 285,451 |
| 2015 | 278,479 |
| 2016 | 302,521 |
| 2017 | 305,640 |
| 2018 | 314,890 |
| 2019 | 311,015 |
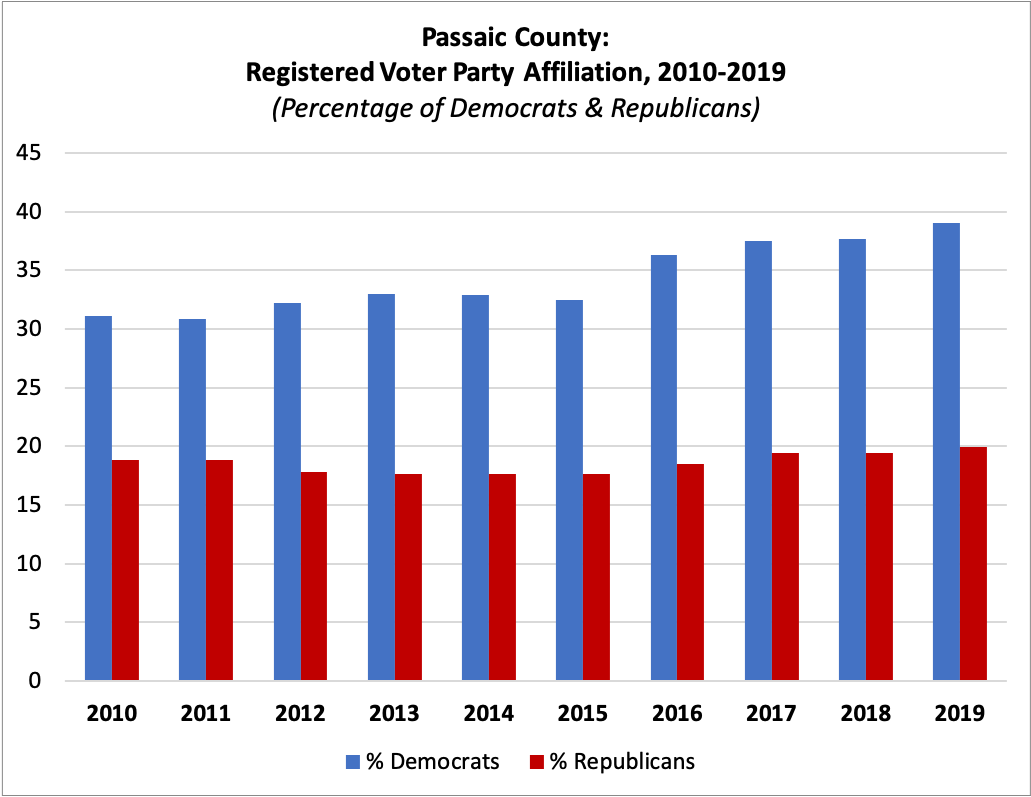
Percent Registered as Democrats
| 2010 | 31.13% |
| 2011 | 30.85% |
| 2012 | 32.19% |
| 2013 | 32.95% |
| 2014 | 32.90% |
| 2015 | 32.47% |
| 2016 | 36.30% |
| 2017 | 37.49% |
| 2018 | 37.71% |
| 2019 | 39.08% |
Percent Registered as Republicans
| 2010 | 18.80% |
| 2011 | 18.80% |
| 2012 | 17.77% |
| 2013 | 17.64% |
| 2014 | 17.65% |
| 2015 | 17.62% |
| 2016 | 18.53% |
| 2017 | 19.46% |
| 2018 | 19.45% |
| 2019 | 19.97% |
For this and more data, visit njdatabook.rutgers.edu!
References
1. Passaic County’s History. Passaic County, NJ Official Website. Retrieved from https://www.passaiccountynj.org/about_us/history/index.php.