
Ocean County is the 2nd largest county according to land area and is made up of 33 municipalities. It was founded in 1850 [1]. On May 6, 1937 the Lakehurst Naval Air Station (today known as part of Joint Base McGuire-Dix-Lakehurst) was the site of the Hindenburg disaster, when the airship Hindenburg crashed, killing 37 passengers and crew.
Ocean County
Facts and Figures from the NJ Data Book
Area
628.8 square miles
Density
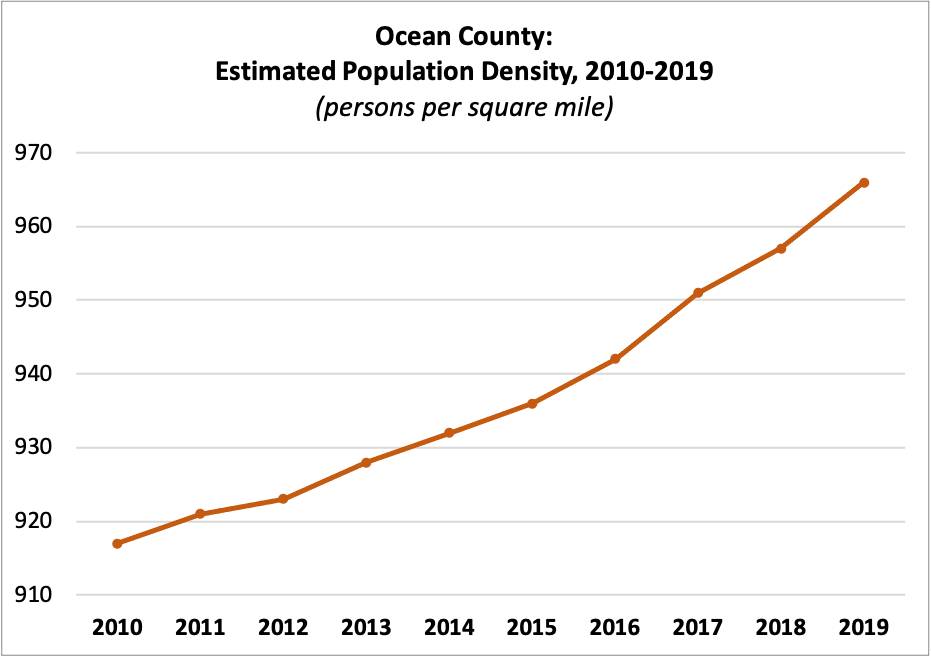
| 2010 | 917 |
| 2011 | 921 |
| 2012 | 923 |
| 2013 | 928 |
| 2014 | 932 |
| 2015 | 936 |
| 2016 | 942 |
| 2017 | 951 |
| 2018 | 957 |
| 2019 | 966 |
Census Population
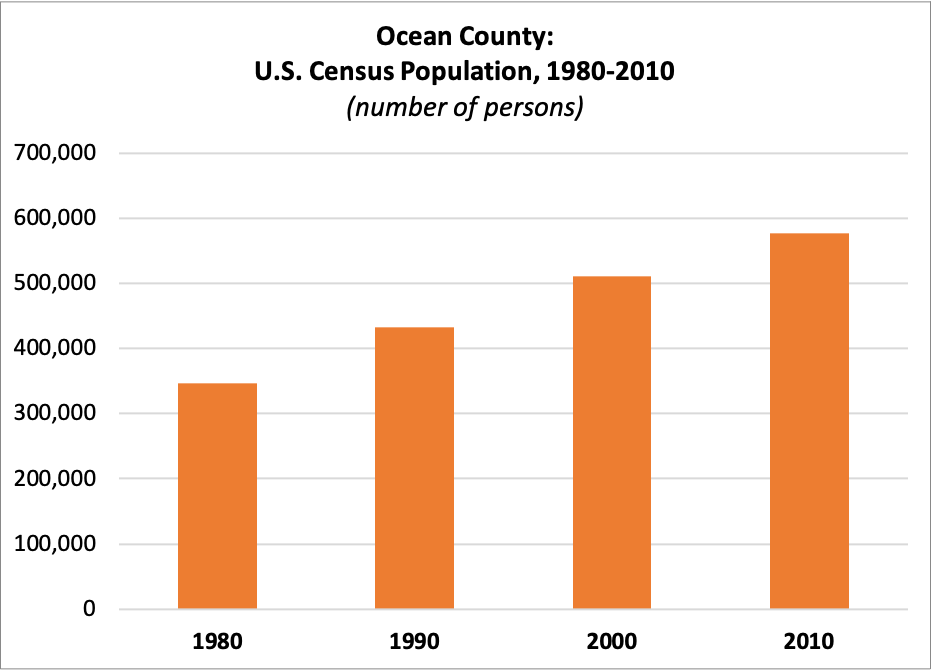
| 1980 | 346,038 |
| 1990 | 433,203 |
| 2000 | 510,916 |
| 2010 | 576,567 |
Estimated Population
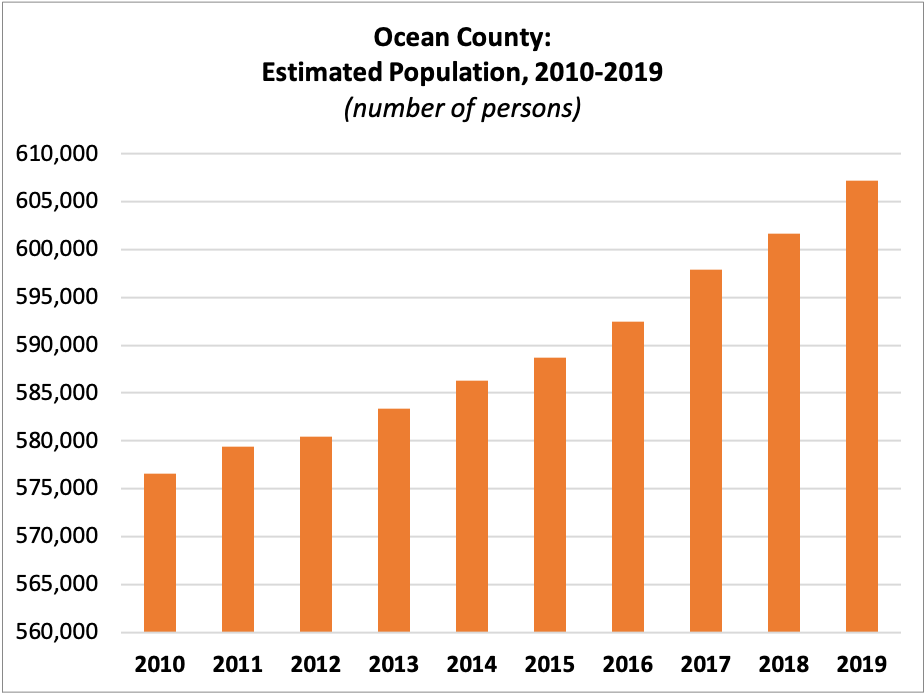
| 2010 | 576,567 |
| 2011 | 579,369 |
| 2012 | 580,470 |
| 2013 | 583,414 |
| 2014 | 586,301 |
| 2015 | 588,721 |
| 2016 | 592,497 |
| 2017 | 597,943 |
| 2018 | 601,651 |
| 2019 | 607,186 |
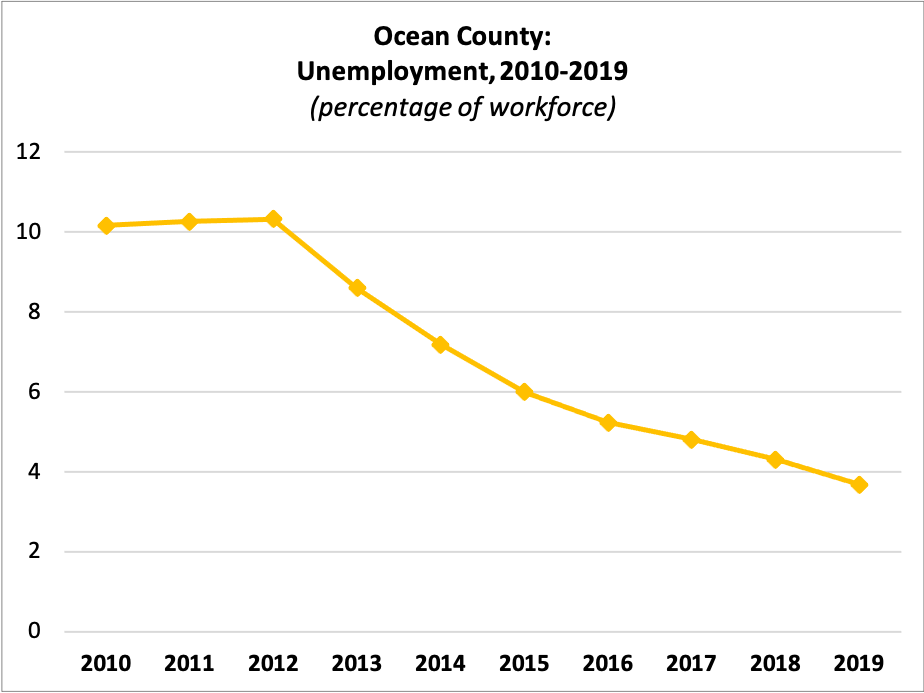
Unemployment
 Workforce:
| 2010 | 265,646 |
| 2011 | 266,575 |
| 2012 | 272,322 |
| 2013 | 266,001 |
| 2014 | 265,297 |
| 2015 | 268,588 |
| 2016 | 268,834 |
| 2017 | 271,112 |
| 2018 | 266,952 |
| 2019 | 275,007 |
Percent Unemployed:
| 2010 | 10.17% |
| 2011 | 10.26% |
| 2012 | 10.33% |
| 2013 | 8.60% |
| 2014 | 7.18% |
| 2015 | 6.00% |
| 2016 | 5.23% |
| 2017 | 4.81% |
| 2018 | 4.31% |
| 2019 | 3.68% |
Median Rent
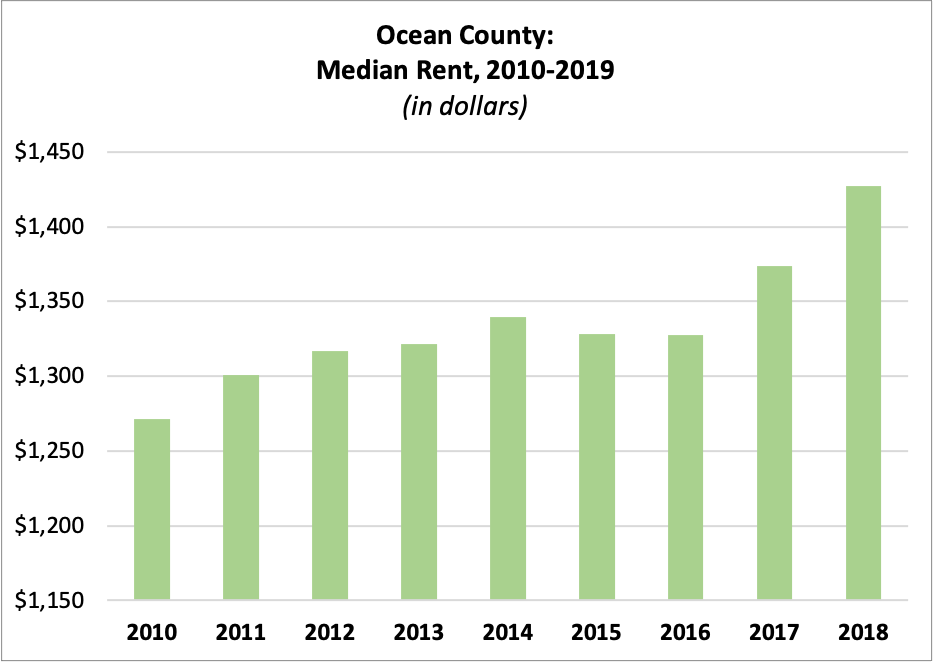
| 2010 | $1,271.50 |
| 2011 | $1,300.95 |
| 2012 | $1,316.48 |
| 2013 | $1,321.76 |
| 2014 | $1,339.74 |
| 2015 | $1,328.14 |
| 2016 | $1,327.29 |
| 2017 | $1,373.77 |
| 2018 | $1,427.47 |
Average Residential Property Value
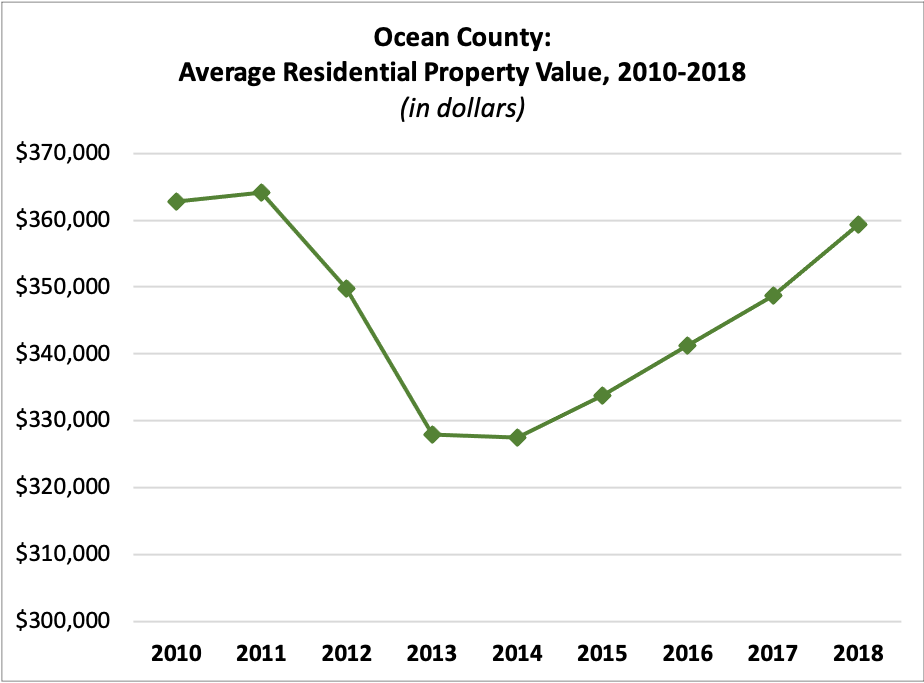
| 2010 | $362,711.63 |
| 2011 | $364,062.96 |
| 2012 | $349,812.58 |
| 2013 | $327,962.33 |
| 2014 | $327,538.14 |
| 2015 | $333,735.80 |
| 2016 | $341,295.58 |
| 2017 | $348,649.13 |
| 2018 | $359,401.84 |
Income per Taxpayer
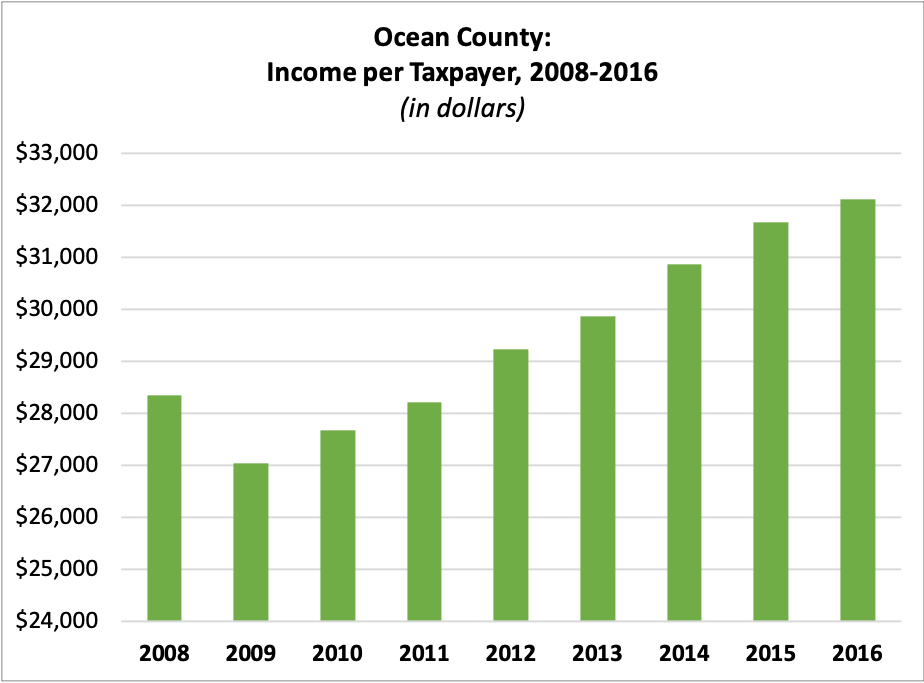
| 2008 | $28,345.88 |
| 2009 | $27,043.54 |
| 2010 | $27,682.19 |
| 2011 | $28,220.83 |
| 2012 | $29,220.94 |
| 2013 | $29,857.96 |
| 2014 | $30,869.15 |
| 2015 | $31,677.51 |
| 2016 | $32,114.64 |
Registered Voters
 Number of Registered Voters
| 2010 | 376,314 |
| 2011 | 367,165 |
| 2012 | 383,260 |
| 2013 | 379,230 |
| 2014 | 381,491 |
| 2015 | 377,815 |
| 2016 | 401,209 |
| 2017 | 400,098 |
| 2018 | 408,860 |
| 2019 | 412,313 |
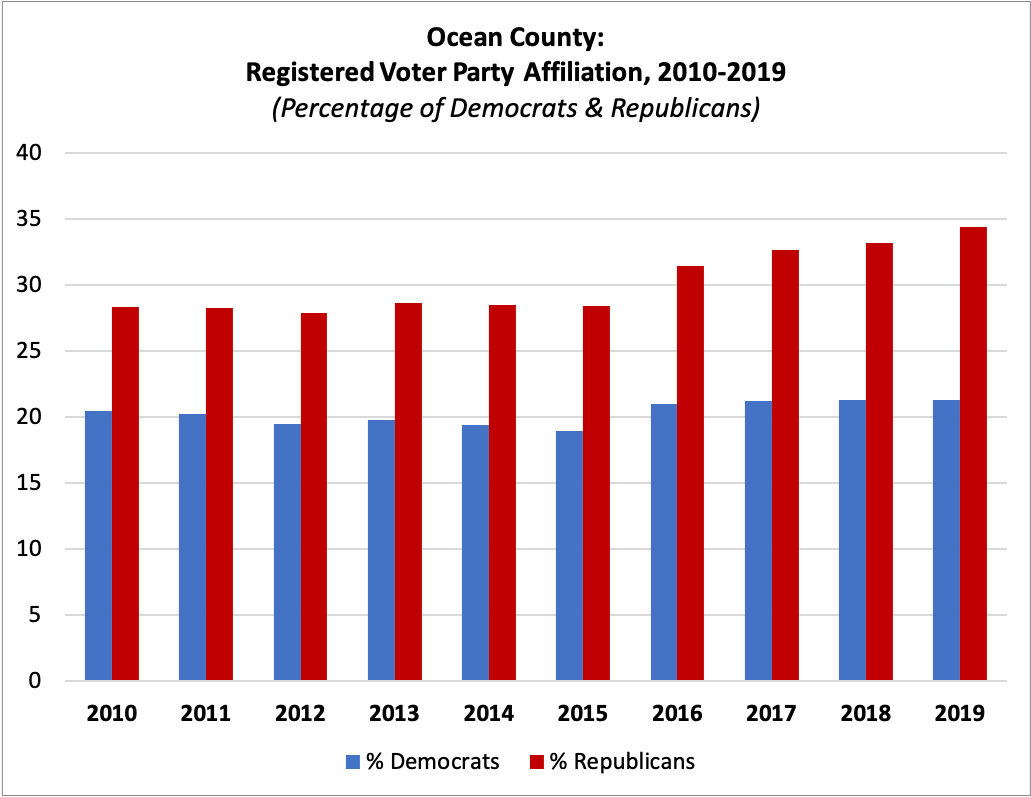
Percent Registered as Democrats
| 2010 | 20.49% |
| 2011 | 20.25% |
| 2012 | 19.49% |
| 2013 | 19.77% |
| 2014 | 19.39% |
| 2015 | 18.91% |
| 2016 | 20.96% |
| 2017 | 21.24% |
| 2018 | 21.30% |
| 2019 | 21.31% |
Percent Registered as Republicans
| 2010 | 28.32% |
| 2011 | 28.29% |
| 2012 | 27.88% |
| 2013 | 28.67% |
| 2014 | 28.48% |
| 2015 | 28.40% |
| 2016 | 31.45% |
| 2017 | 32.66% |
| 2018 | 33.21% |
| 2019 | 34.44% |
For this and more data, visit njdatabook.rutgers.edu!
References
1. Ocean County Timeline. Ocean County, NJ Official Website. Retrieved from https://www.co.ocean.nj.us/ch/frmOCTimeline.aspx.