
Posted On
Monmouth County is the 6th largest county by land area and incorporates 53 municipalities, including some of our beloved Jersey Shore coastline!
Monmouth County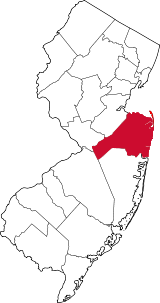
Facts and Figures from the NJ Data Book
Area
468.81 square miles
Density
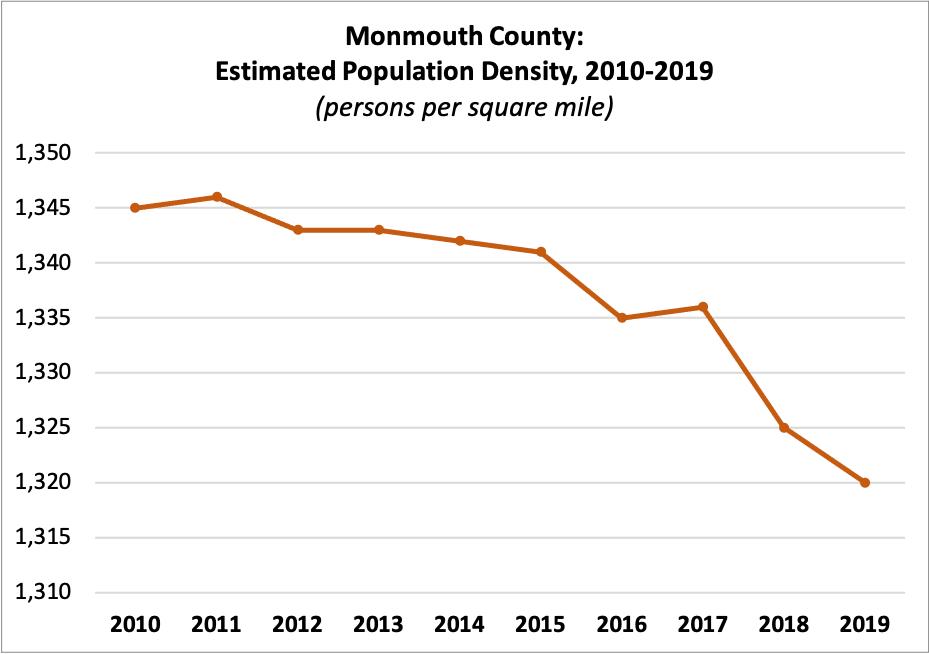
| 2010 | 1,345 |
| 2011 | 1,346 |
| 2012 | 1,343 |
| 2013 | 1,343 |
| 2014 | 1,342 |
| 2015 | 1,341 |
| 2016 | 1,335 |
| 2017 | 1,336 |
| 2018 | 1,325 |
| 2019 | 1,320 |
Census Population
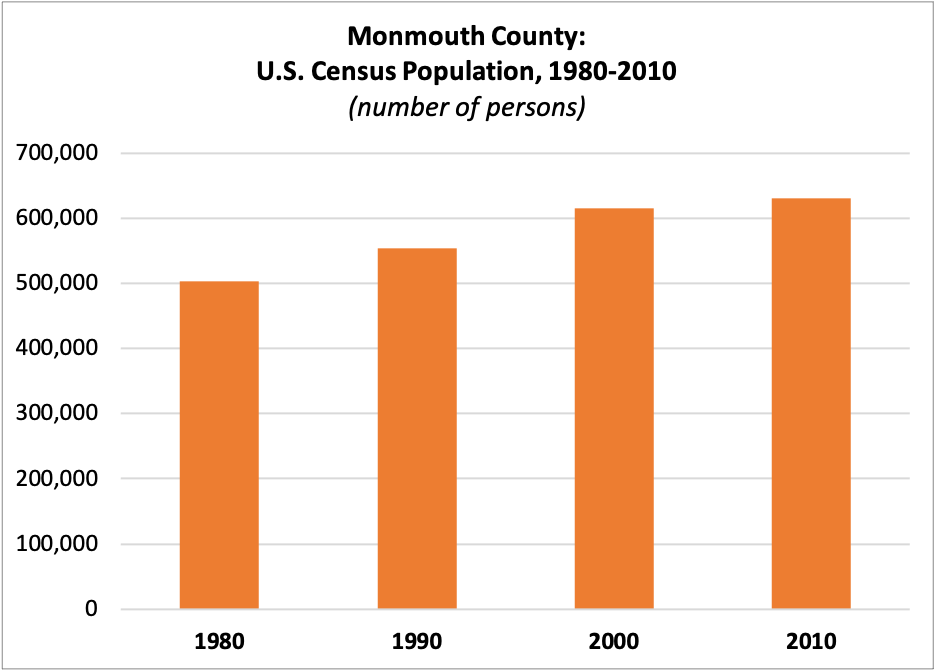
| 1980 | 503,173 |
| 1990 | 553,093 |
| 2000 | 615,301 |
| 2010 | 630,380 |
Estimated Population
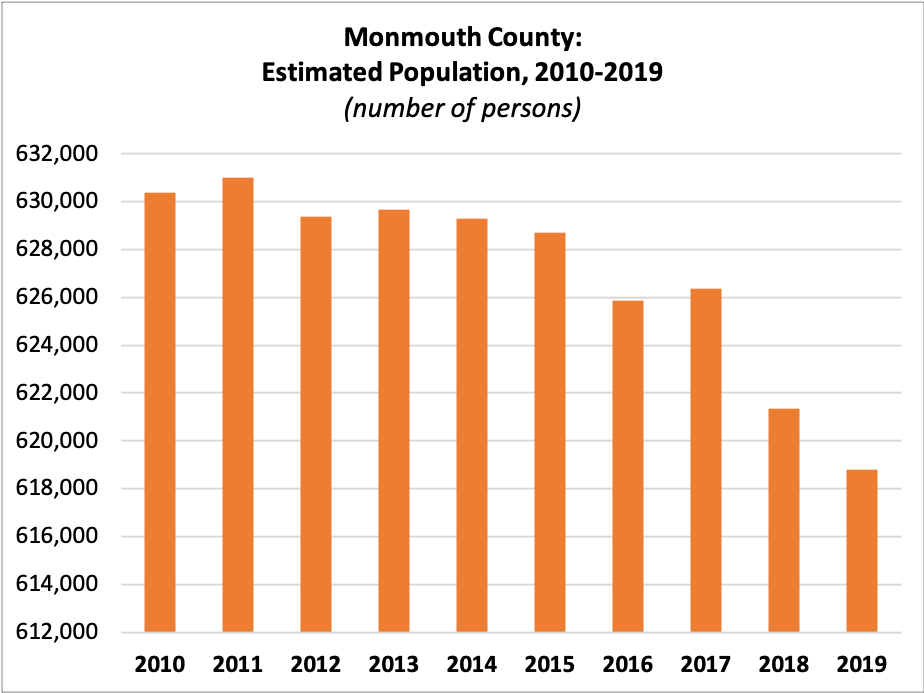
| 2010 | 630,380 |
| 2011 | 631,020 |
| 2012 | 629,384 |
| 2013 | 629,672 |
| 2014 | 629,279 |
| 2015 | 628,715 |
| 2016 | 625,846 |
| 2017 | 626,351 |
| 2018 | 621,354 |
| 2019 | 618,795 |
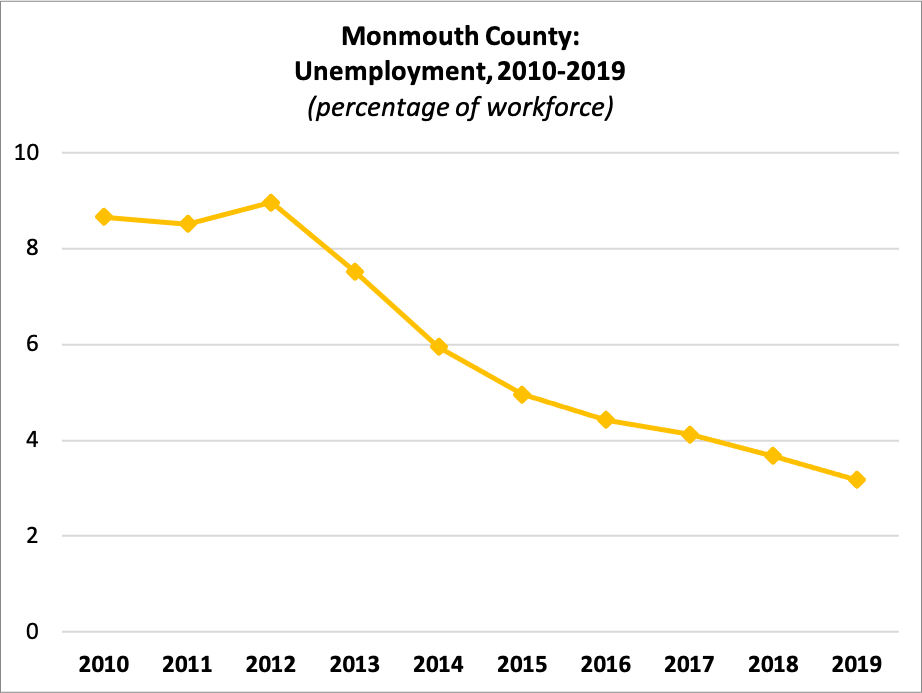
Unemployment
 Workforce:
| 2010 | 332,599 |
| 2011 | 330,947 |
| 2012 | 335,050 |
| 2013 | 329,905 |
| 2014 | 328,658 |
| 2015 | 331,619 |
| 2016 | 331,131 |
| 2017 | 330,696 |
| 2018 | 323,112 |
| 2019 | 328,662 |
Percent Unemployed:
| 2010 | 8.66% |
| 2011 | 8.51% |
| 2012 | 8.96% |
| 2013 | 7.52% |
| 2014 | 5.95% |
| 2015 | 4.96% |
| 2016 | 4.43% |
| 2017 | 4.12% |
| 2018 | 3.67% |
| 2019 | 3.17% |
Median Rent
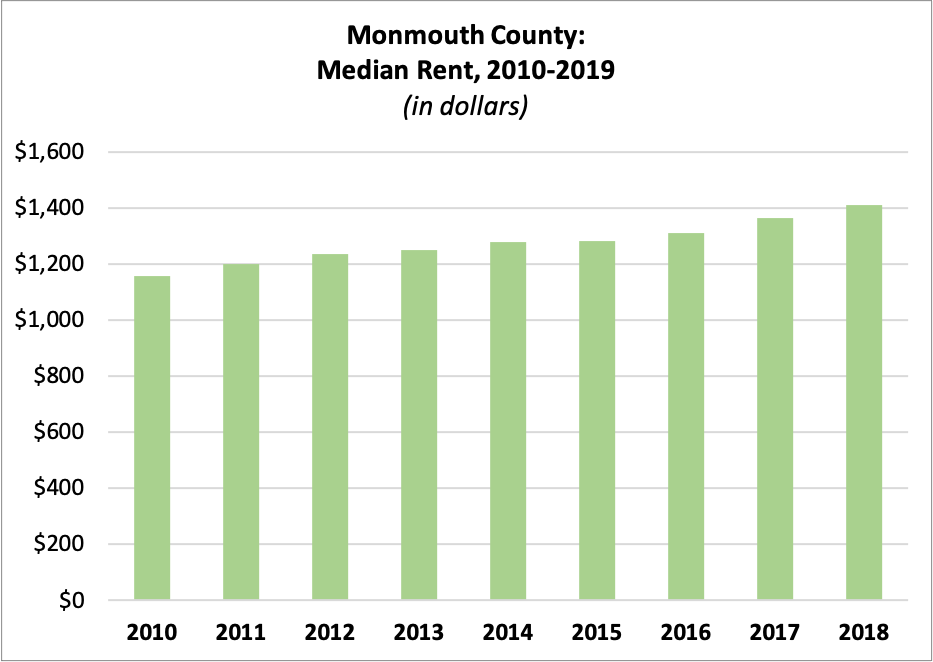
| 2010 | $1,157.59 |
| 2011 | $1,201.06 |
| 2012 | $1,234.91 |
| 2013 | $1,250.19 |
| 2014 | $1,278.26 |
| 2015 | $1,282.40 |
| 2016 | $1,310.21 |
| 2017 | $1,363.33 |
| 2018 | $1,411.23 |
Average Residential Property Value
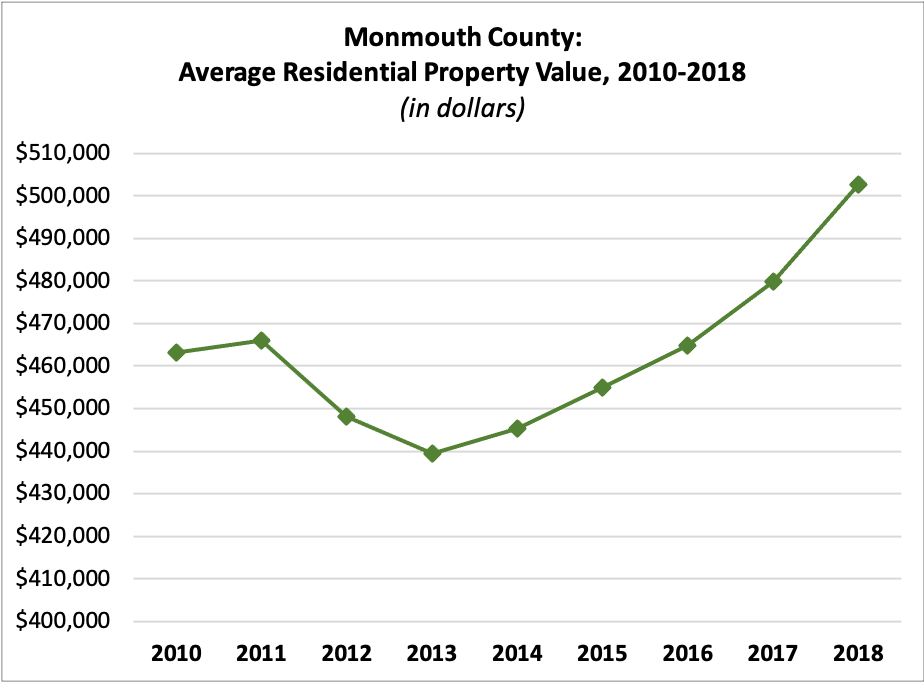
| 2010 | $463,184.26 |
| 2011 | $466,036.88 |
| 2012 | $448,020.75 |
| 2013 | $439,341.29 |
| 2014 | $445,330.72 |
| 2015 | $454,911.08 |
| 2016 | $464,737.58 |
| 2017 | $479,792.34 |
| 2018 | $502,553.97 |
Income per Taxpayer
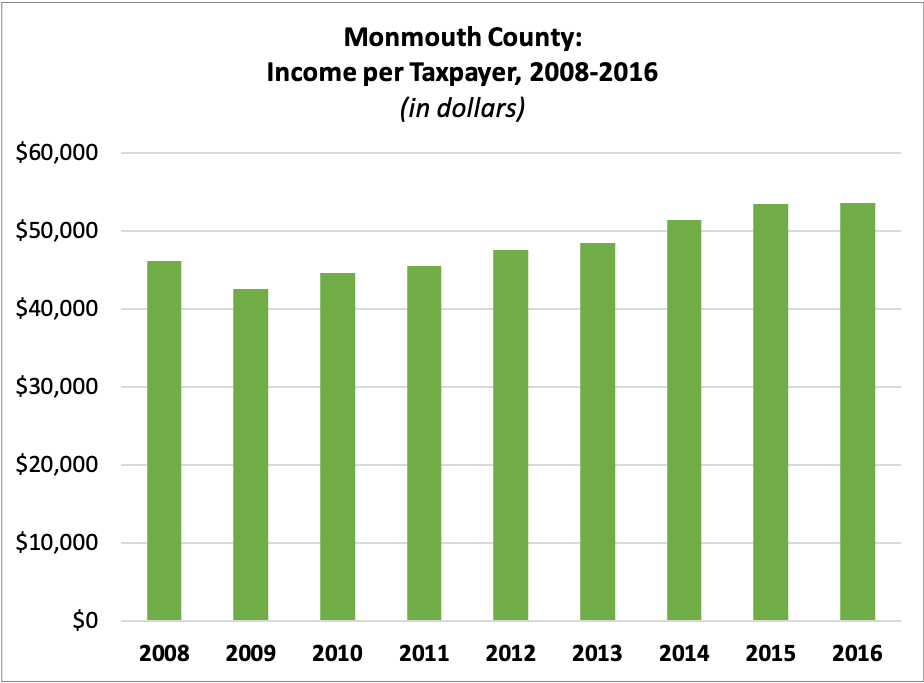
| 2008 | $46,159.15 |
| 2009 | $42,558.94 |
| 2010 | $44,701.09 |
| 2011 | $45,565.35 |
| 2012 | $47,668.93 |
| 2013 | $48,479.64 |
| 2014 | $51,401.82 |
| 2015 | $53,508.53 |
| 2016 | $53,617.48 |
Registered Voters
 Number of Registered Voters
| 2010 | 417,028 |
| 2011 | 409,214 |
| 2012 | 425,634 |
| 2013 | 426,071 |
| 2014 | 428,212 |
| 2015 | 418,830 |
| 2016 | 446,831 |
| 2017 | 445,523 |
| 2018 | 457,221 |
| 2019 | 461,600 |
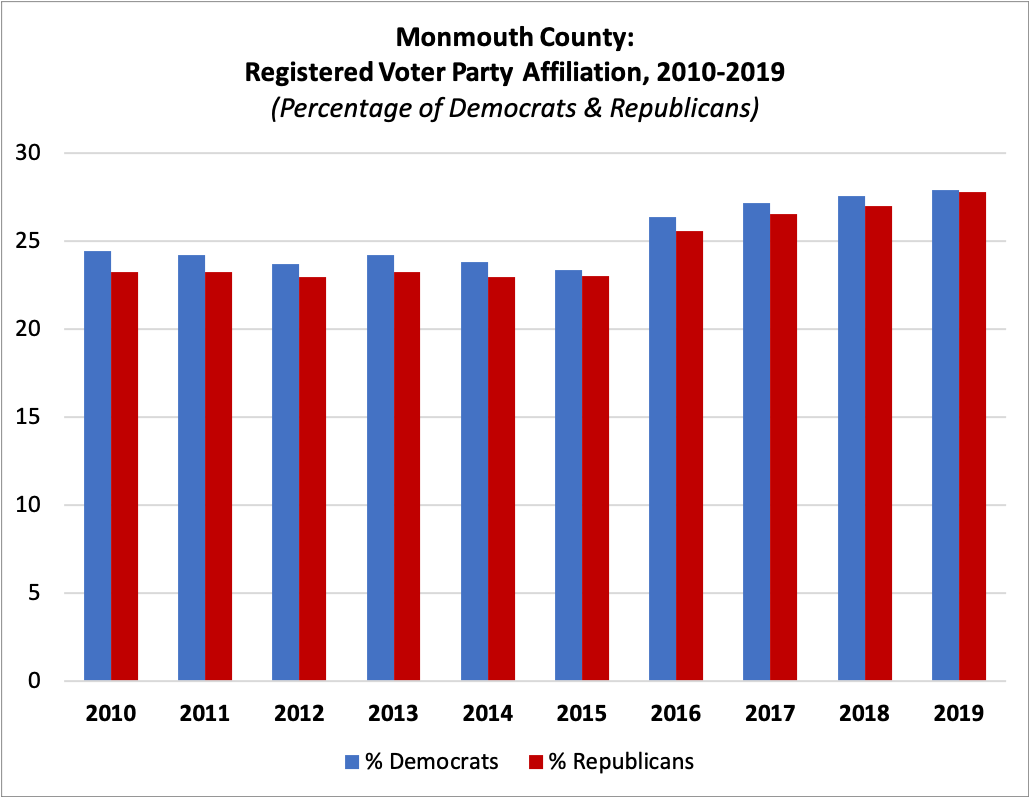
Percent Registered as Democrats
| 2010 | 24.43% |
| 2011 | 24.19% |
| 2012 | 23.71% |
| 2013 | 24.20% |
| 2014 | 23.80% |
| 2015 | 23.36% |
| 2016 | 26.36% |
| 2017 | 27.18% |
| 2018 | 27.58% |
| 2019 | 27.93% |
Percent Registered as Republicans
| 2010 | 23.22% |
| 2011 | 23.22% |
| 2012 | 22.97% |
| 2013 | 23.23% |
| 2014 | 22.98% |
| 2015 | 23.00% |
| 2016 | 25.58% |
| 2017 | 26.54% |
| 2018 | 26.99% |
| 2019 | 27.78% |
For this and more data, visit njdatabook.rutgers.edu!