Posted On
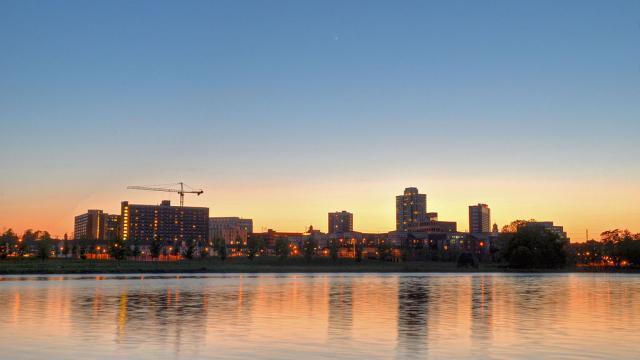
Middlesex County was first in the nation to create a vocational and technical school system, which formed in New Brunswick in 1914. [1] The county ranks 12th in land area and consists of 25 municipalities.
Middlesex County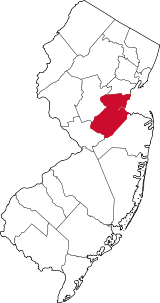
Facts and Figures from the NJ Data Book
Area
308.92 square miles
Density
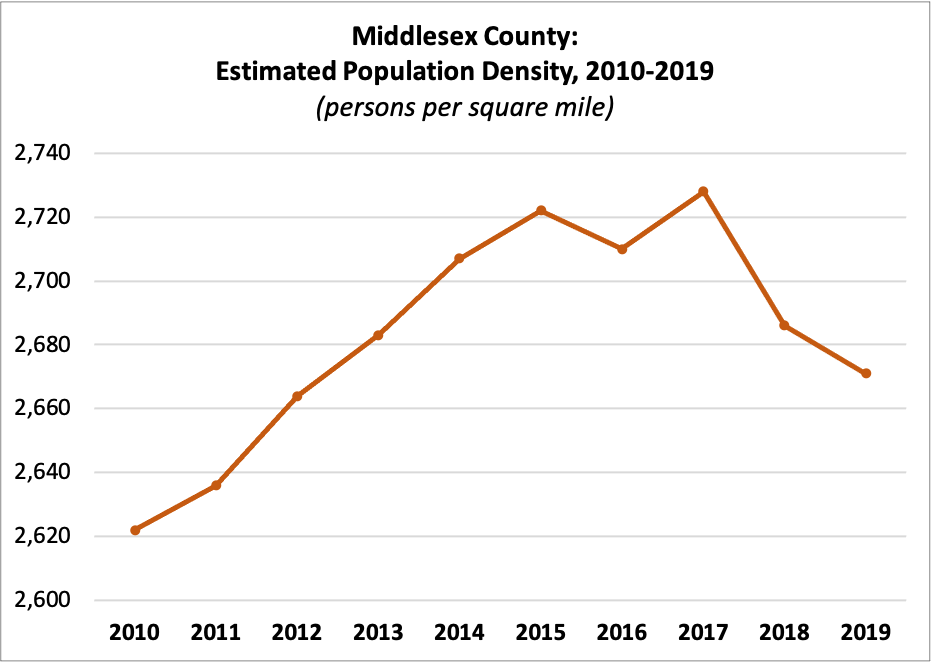
| 2010 | 2,622 |
| 2011 | 2,636 |
| 2012 | 2,664 |
| 2013 | 2,683 |
| 2014 | 2,707 |
| 2015 | 2,722 |
| 2016 | 2,710 |
| 2017 | 2,728 |
| 2018 | 2,686 |
| 2019 | 2,671 |
Census Population
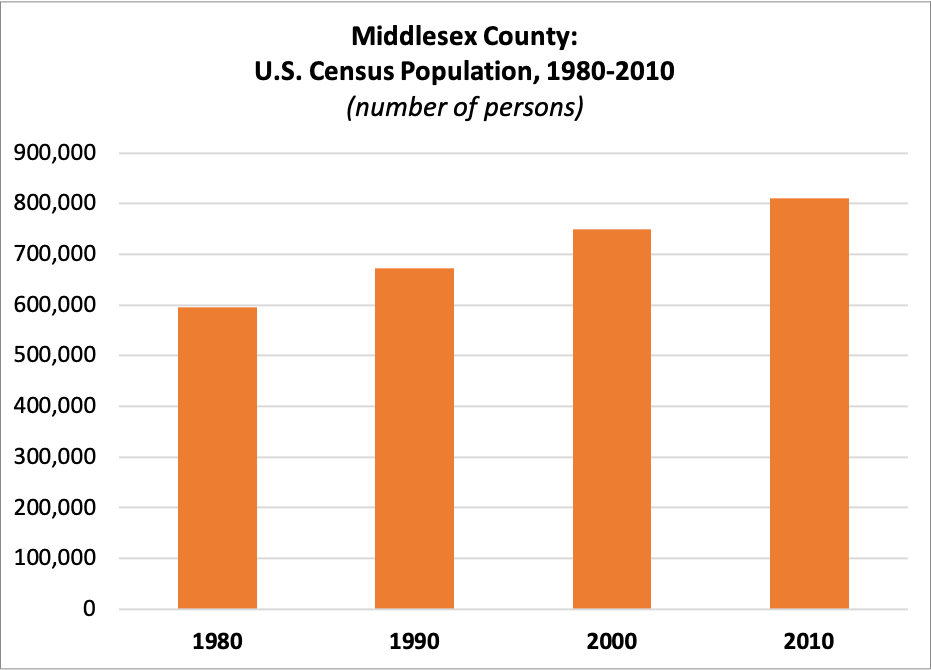
| 1980 | 595,893 |
| 1990 | 671,811 |
| 2000 | 750,162 |
| 2010 | 809,858 |
Estimated Population
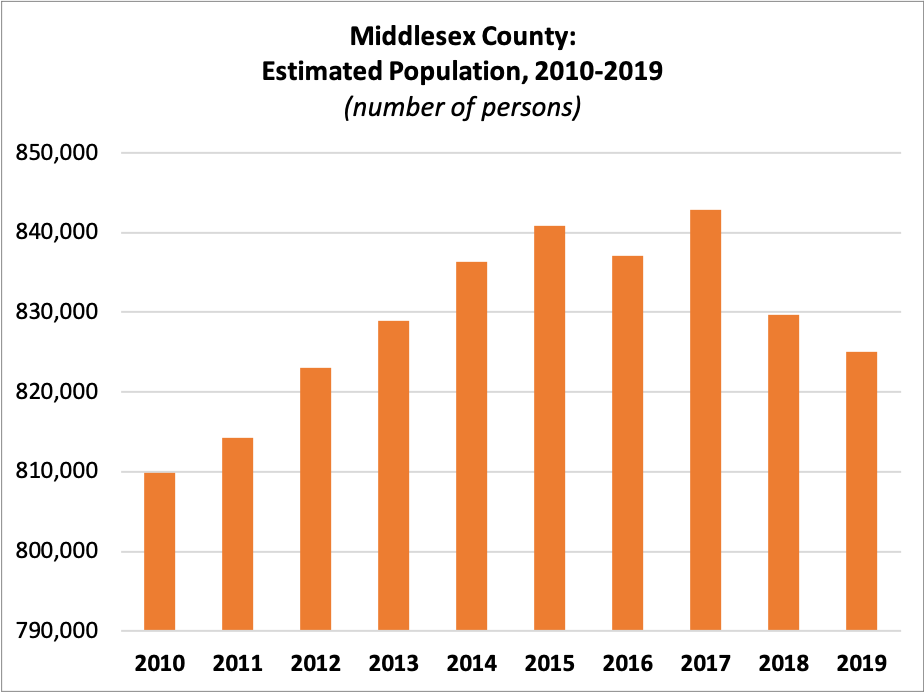
| 2010 | 809,858 |
| 2011 | 814,217 |
| 2012 | 823,041 |
| 2013 | 828,919 |
| 2014 | 836,297 |
| 2015 | 840,900 |
| 2016 | 837,073 |
| 2017 | 842,798 |
| 2018 | 829,685 |
| 2019 | 825,062 |
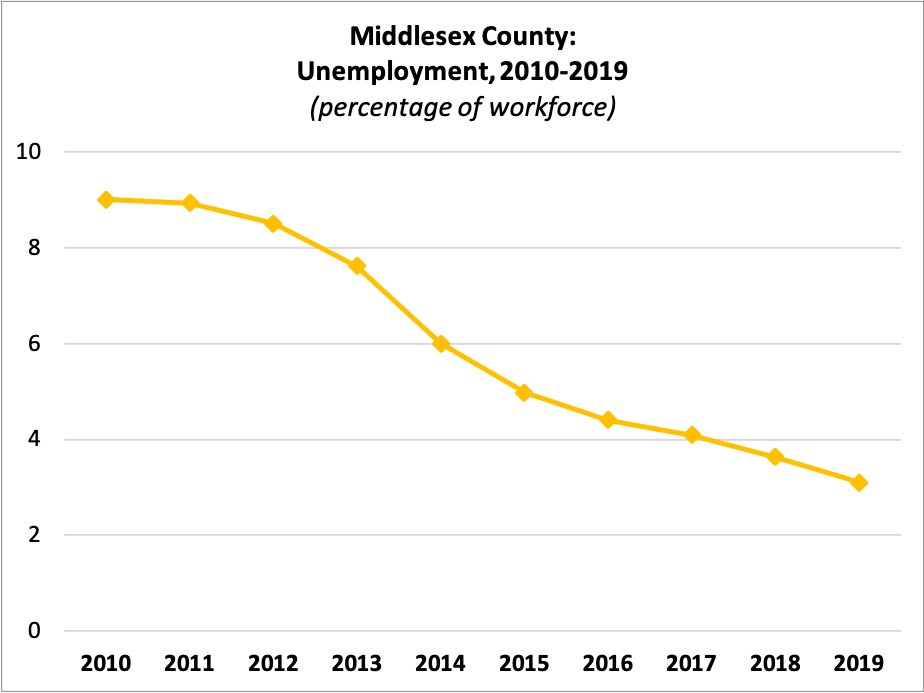
Unemployment
 Workforce:
| 2010 | 424,415 |
| 2011 | 428,259 |
| 2012 | 443,969 |
| 2013 | 445,488 |
| 2014 | 432,109 |
| 2015 | 440,342 |
| 2016 | 442,438 |
| 2017 | 442,307 |
| 2018 | 435,053 |
| 2019 | 439,072 |
Percent Unemployed:
| 2010 | 9.01% |
| 2011 | 8.94% |
| 2012 | 8.51% |
| 2013 | 7.62% |
| 2014 | 6.00% |
| 2015 | 4.98% |
| 2016 | 4.41% |
| 2017 | 4.09% |
| 2018 | 3.63% |
| 2019 | 3.10% |
Median Rent
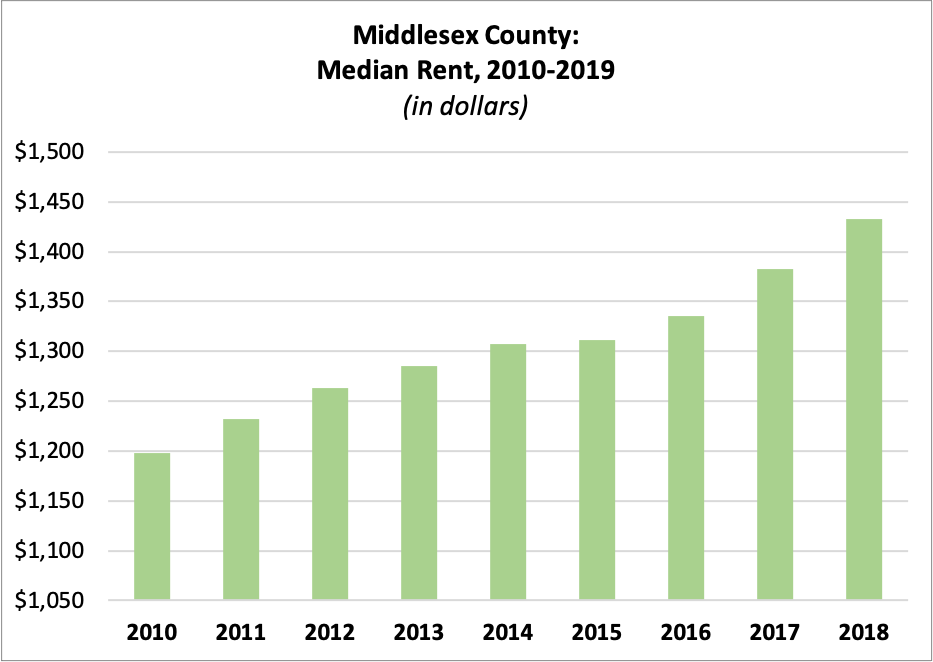
| 2010 | $1,197.62 |
| 2011 | $1,231.70 |
| 2012 | $1,263.50 |
| 2013 | $1,285.14 |
| 2014 | $1,307.60 |
| 2015 | $1,311.32 |
| 2016 | $1,335.45 |
| 2017 | $1,382.81 |
| 2018 | $1,432.80 |
Average Residential Property Value
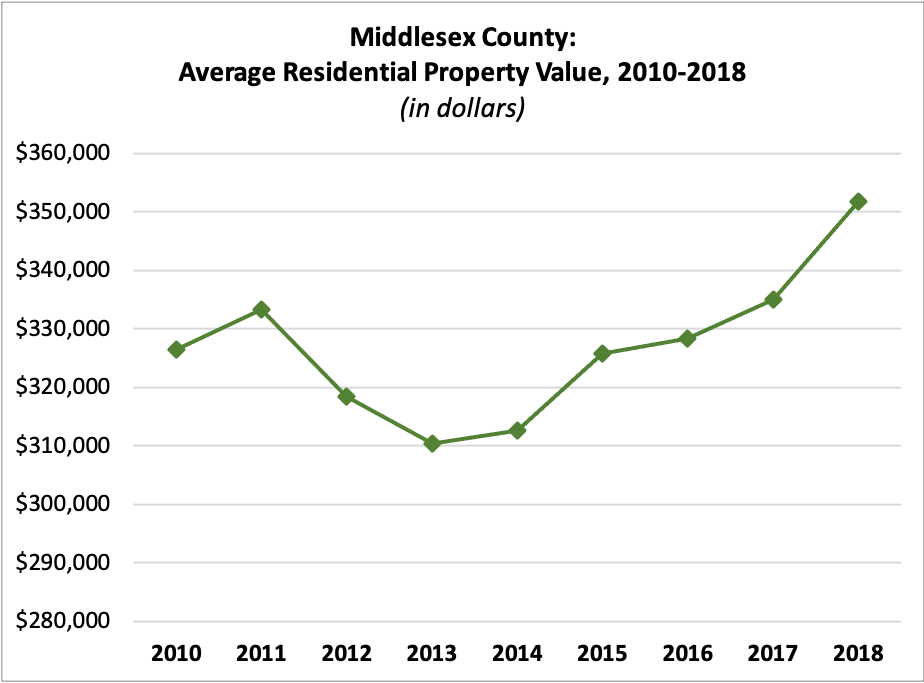
| 2010 | $326,529.20 |
| 2011 | $333,243.60 |
| 2012 | $318,400.66 |
| 2013 | $310,371.12 |
| 2014 | $312,525.67 |
| 2015 | $325,755.58 |
| 2016 | $328,263.89 |
| 2017 | $334,993.23 |
| 2018 | $351,717.87 |
Income per Taxpayer
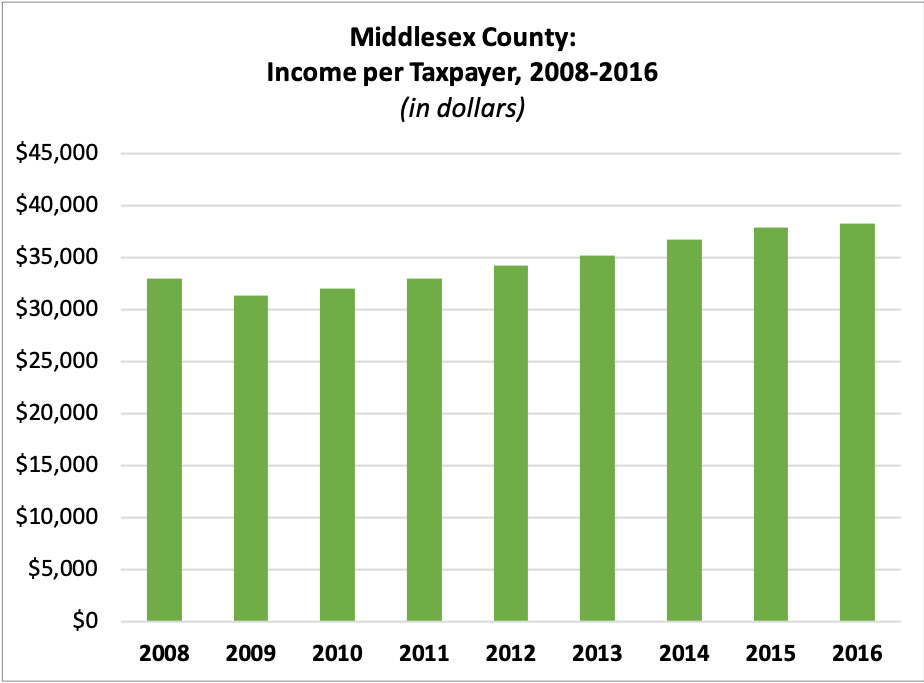
| 2008 | $32,991.15 |
| 2009 | $31,312.76 |
| 2010 | $31,961.34 |
| 2011 | $32,970.23 |
| 2012 | $34,223.02 |
| 2013 | $35,122.84 |
| 2014 | $36,684.39 |
| 2015 | $37,855.54 |
| 2016 | $38,259.11 |
Registered Voters
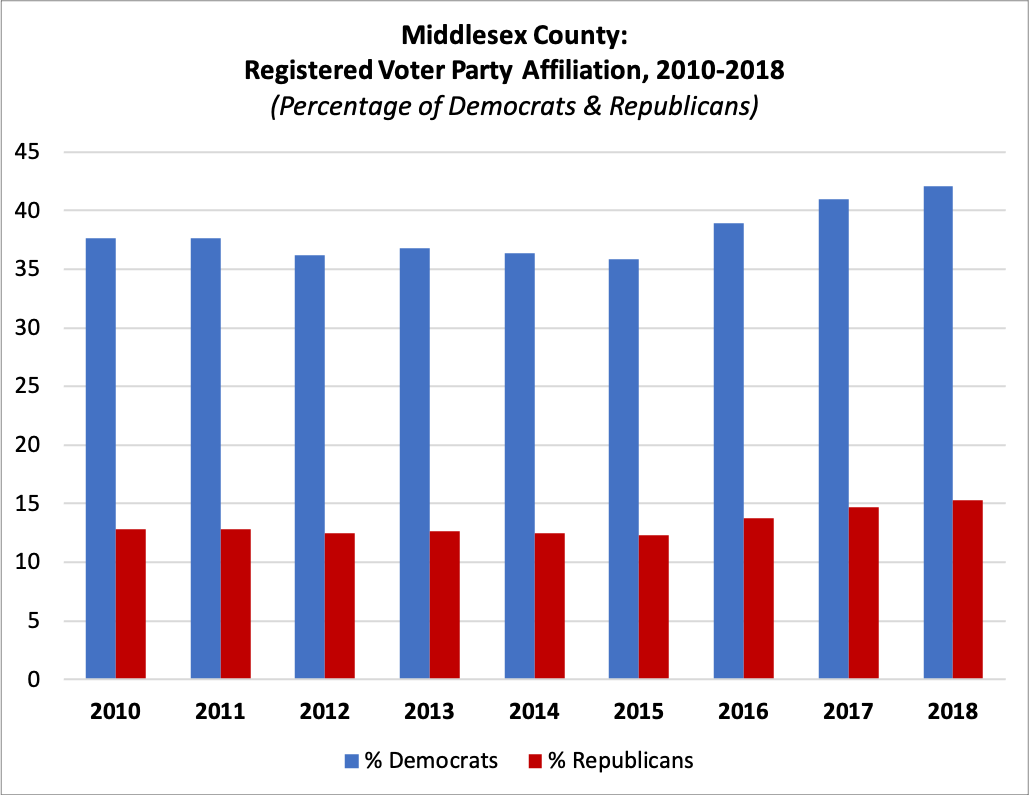 Number of Registered Voters
| 2010 | 454,163 |
| 2011 | 440,997 |
| 2012 | 470,357 |
| 2013 | 475,887 |
| 2014 | 477,653 |
| 2015 | 480,203 |
| 2016 | 518,740 |
| 2017 | 496,533 |
| 2018 | 513,228 |
| 2019 | 536,853 |
Percent Registered as Democrats
| 2010 | 37.62% |
| 2011 | 37.65% |
| 2012 | 36.16% |
| 2013 | 36.81% |
| 2014 | 36.40% |
| 2015 | 35.88% |
| 2016 | 38.92% |
| 2017 | 40.98% |
| 2018 | 42.07% |
| 2019 | no data |
Percent Registered as Republicans
| 2010 | 12.78% |
| 2011 | 12.80% |
| 2012 | 12.48% |
| 2013 | 12.65% |
| 2014 | 12.45% |
| 2015 | 12.33% |
| 2016 | 13.79% |
| 2017 | 14.66% |
| 2018 | 15.26% |
| 2019 | no data |
For this and more data, visit njdatabook.rutgers.edu!
References
- Middlesex County History. Middlesex County, NJ Official Website. Retrieved from http://www.middlesexcountynj.gov/About/Pages/History.aspx.