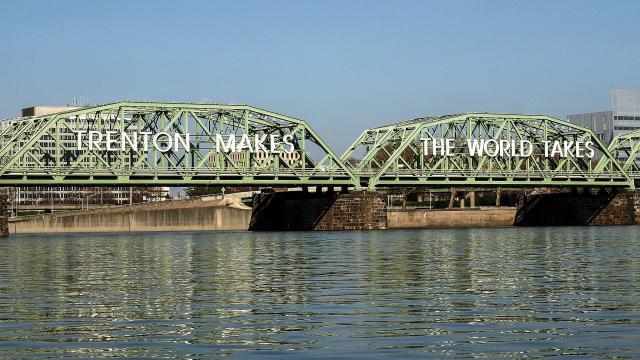
Mercer County was founded in 1838 and is built of 14 municipalities, one of which is the state capital of Trenton. The County is relatively small, ranking 16th in land area. Its historical significance, however, is definitely not small – the famous crossing of the Delaware River by General George Washington occurred in what is now Mercer County during the American Revolutionary War. [1]
Mercer County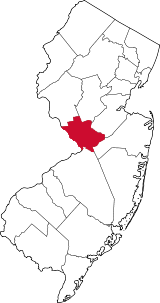
Facts and Figures from the NJ Data Book
Area
224.56 square miles
Density
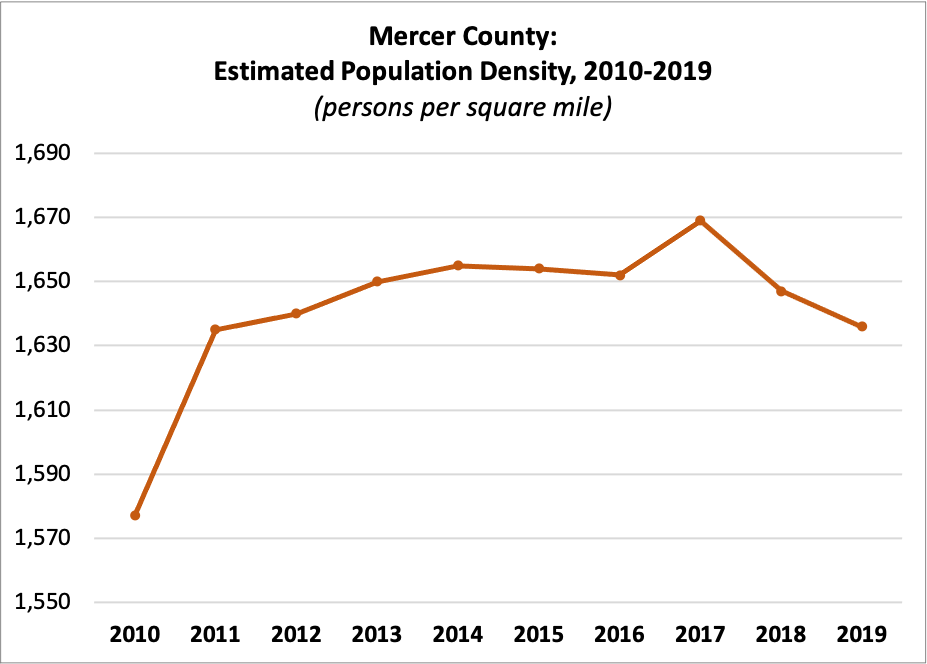
| 2010 | 1,577 |
| 2011 | 1,635 |
| 2012 | 1,640 |
| 2013 | 1,650 |
| 2014 | 1,655 |
| 2015 | 1,654 |
| 2016 | 1,652 |
| 2017 | 1,669 |
| 2018 | 1,647 |
| 2019 | 1,636 |
Census Population
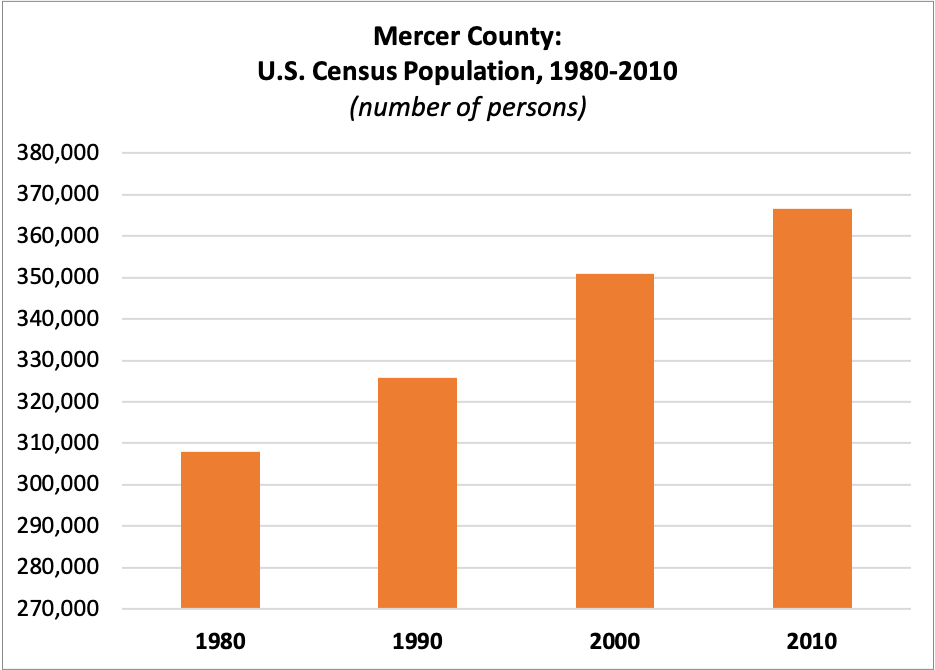
| 1980 | 307,863 |
| 1990 | 325,824 |
| 2000 | 350,761 |
| 2010 | 366,513 |
Estimated Population
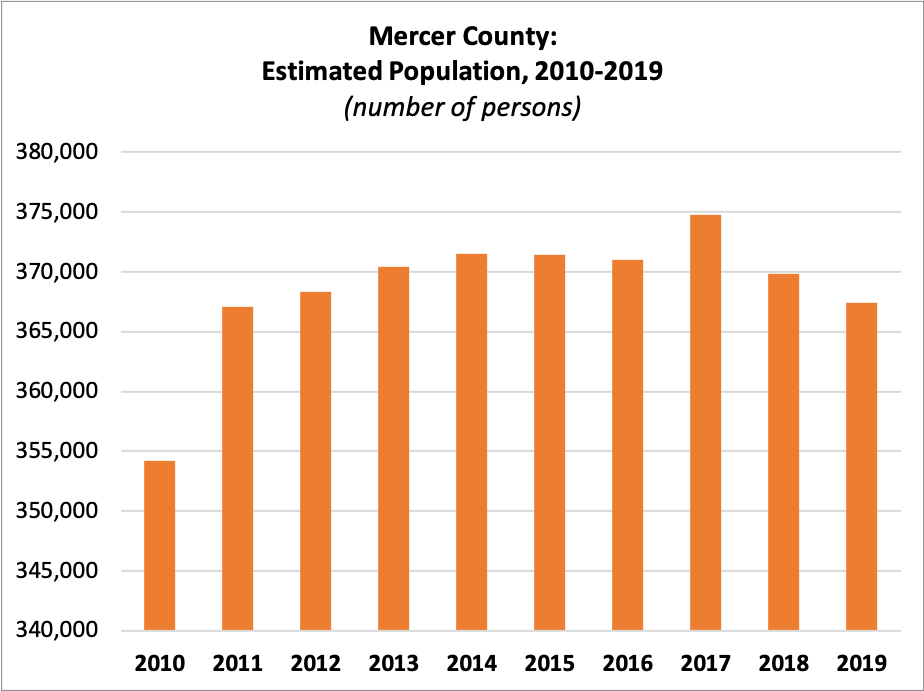
| 2010 | 354,206 |
| 2011 | 367,063 |
| 2012 | 368,303 |
| 2013 | 370,414 |
| 2014 | 371,537 |
| 2015 | 371,398 |
| 2016 | 371,023 |
| 2017 | 374,733 |
| 2018 | 369,811 |
| 2019 | 367,430 |
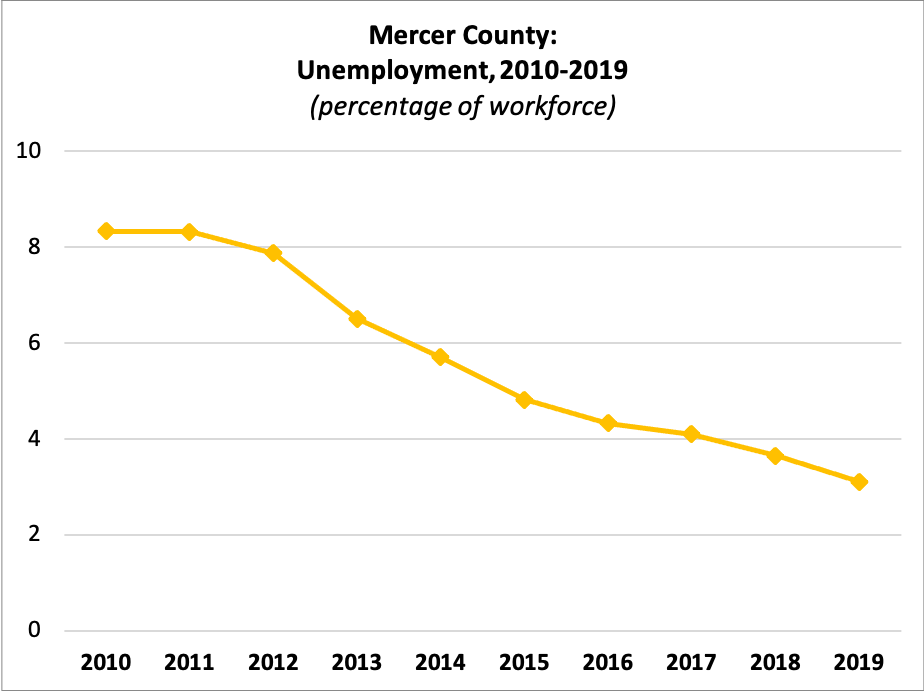
Unemployment
 Workforce:
| 2010 | 189,412 |
| 2011 | 190,819 |
| 2012 | 210,131 |
| 2013 | 207,584 |
| 2014 | 194,497 |
| 2015 | 199,026 |
| 2016 | 199,777 |
| 2017 | 198,839 |
| 2018 | 196,455 |
| 2019 | 202,735 |
Percent Unemployed:
| 2010 | 8.33% |
| 2011 | 8.32% |
| 2012 | 7.87% |
| 2013 | 6.51% |
| 2014 | 5.70% |
| 2015 | 4.81% |
| 2016 | 4.32% |
| 2017 | 4.10% |
| 2018 | 3.65% |
| 2019 | 3.10% |
Median Rent
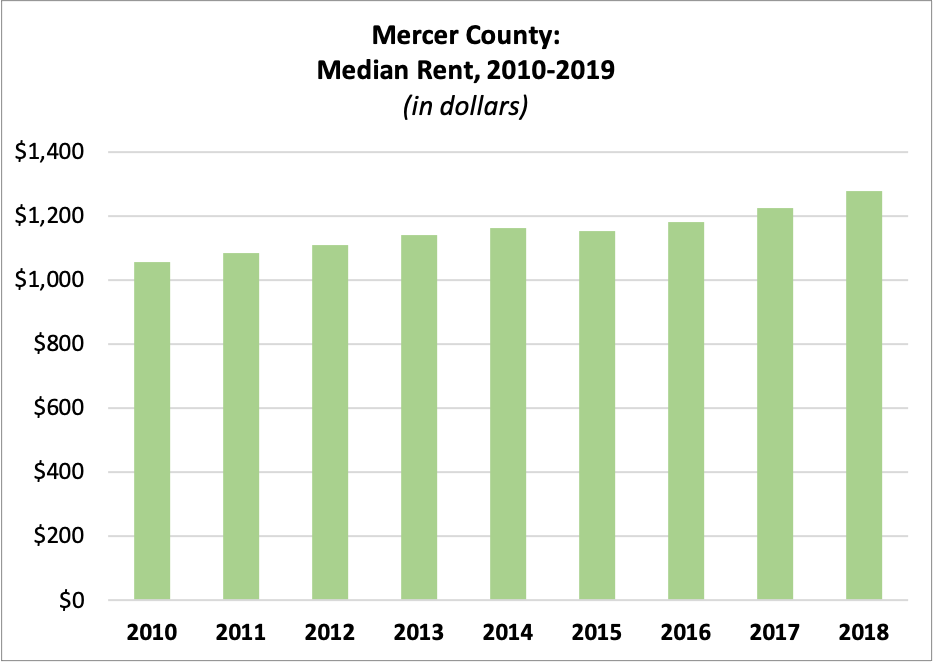
| 2010 | $1,056.31 |
| 2011 | $1,084.42 |
| 2012 | $1,108.95 |
| 2013 | $1,139.17 |
| 2014 | $1,163.59 |
| 2015 | $1,154.08 |
| 2016 | $1,179.85 |
| 2017 | $1,226.17 |
| 2018 | $1,278.99 |
Average Residential Property Value
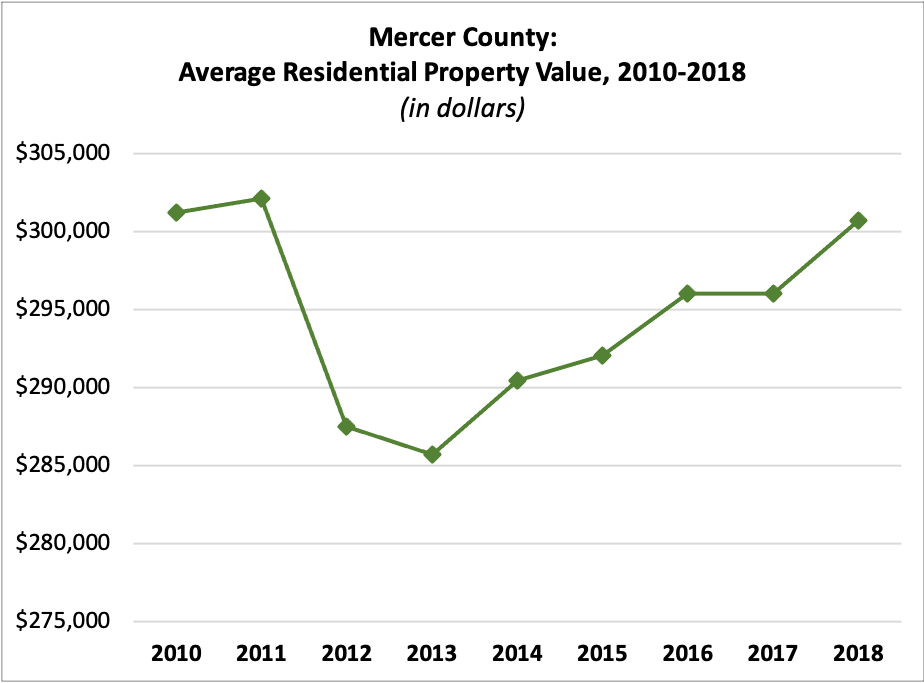
| 2010 | $301,173.42 |
| 2011 | $302,073.48 |
| 2012 | $287,454.84 |
| 2013 | $285,712.49 |
| 2014 | $290,420.12 |
| 2015 | $292,038.85 |
| 2016 | $296,032.48 |
| 2017 | $296,017.52 |
| 2018 | $300,712.34 |
Income per Taxpayer
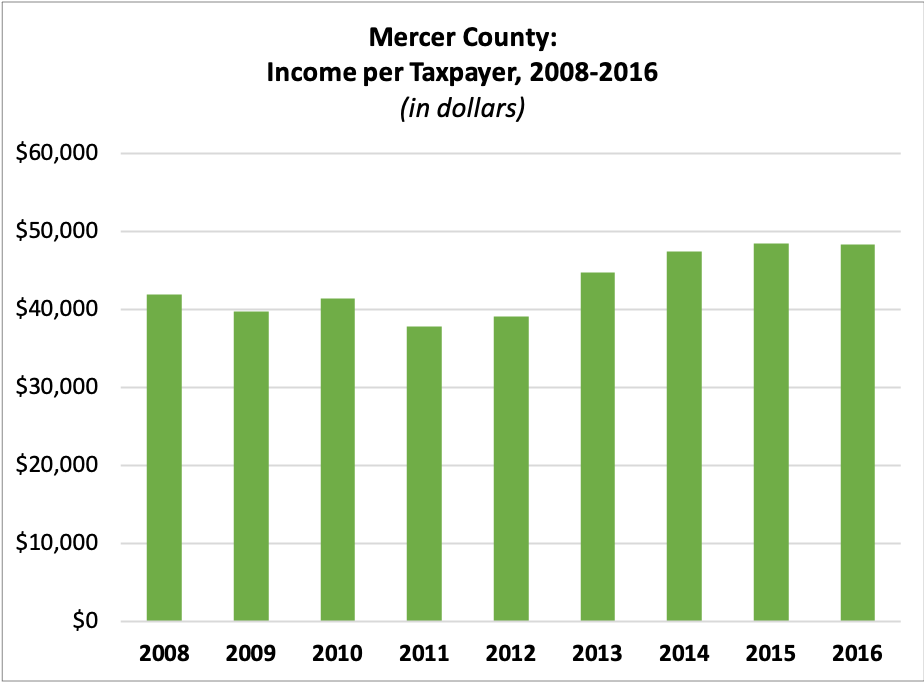
| 2008 | $41,911.74 |
| 2009 | $39,723.71 |
| 2010 | $41,388.88 |
| 2011 | $37,759.66 |
| 2012 | $39,038.19 |
| 2013 | $44,748.94 |
| 2014 | $47,472.02 |
| 2015 | $48,427.25 |
| 2016 | $48,301.03 |
Registered Voters
 Number of Registered Voters
| 2010 | 217,898 |
| 2011 | 212,182 |
| 2012 | 226,315 |
| 2013 | 219,560 |
| 2014 | 222,476 |
| 2015 | 217,995 |
| 2016 | 235,447 |
| 2017 | 233,743 |
| 2018 | 243,230 |
| 2019 | 253,013 |
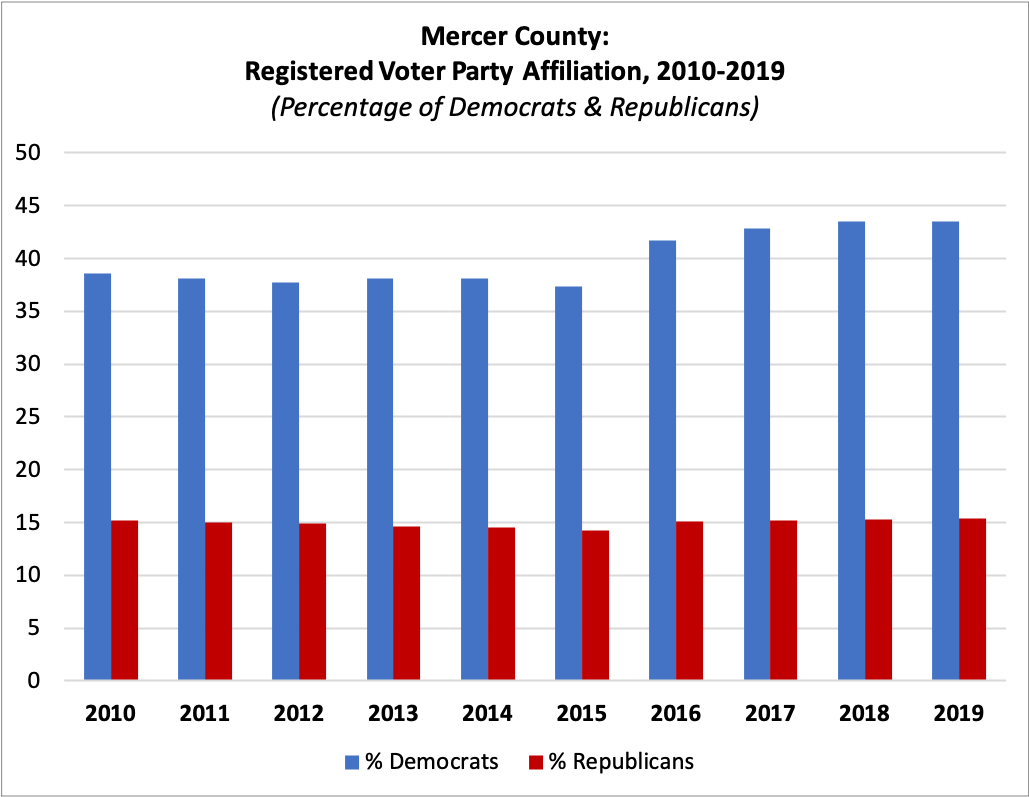
Percent Registered as Democrats
| 2010 | 38.58% |
| 2011 | 38.07% |
| 2012 | 37.76% |
| 2013 | 38.11% |
| 2014 | 38.13% |
| 2015 | 37.31% |
| 2016 | 41.72% |
| 2017 | 42.86% |
| 2018 | 43.50% |
| 2019 | 43.48% |
Percent Registered as Republicans
| 2010 | 15.21% |
| 2011 | 15.03% |
| 2012 | 14.94% |
| 2013 | 14.65% |
| 2014 | 14.51% |
| 2015 | 14.27% |
| 2016 | 15.09% |
| 2017 | 15.22% |
| 2018 | 15.26% |
| 2019 | 15.35% |
For this and more data, visit njdatabook.rutgers.edu!
References
1. History. Mercer County, NJ Official Website. Retrieved from https://www.mercercounty.org/community/history.