Posted On
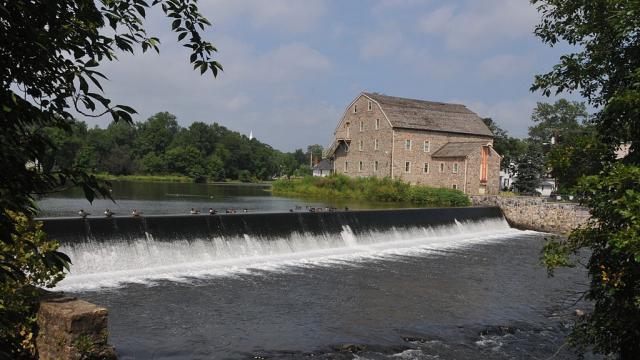
Hunterdon County was named for Robert Hunter, a British military officer and Colonial Governor of both New York and New Jersey in the 1700s. [1] The County was founded on March 22, 1714. [2] Home to 26 municipalities, Hunterdon County is the eighth-largest county in land area.
Hunterdon County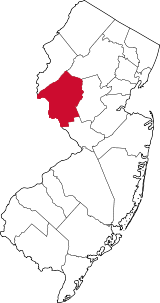
Facts and Figures from the NJ Data Book
Area
427.84 square miles
Density
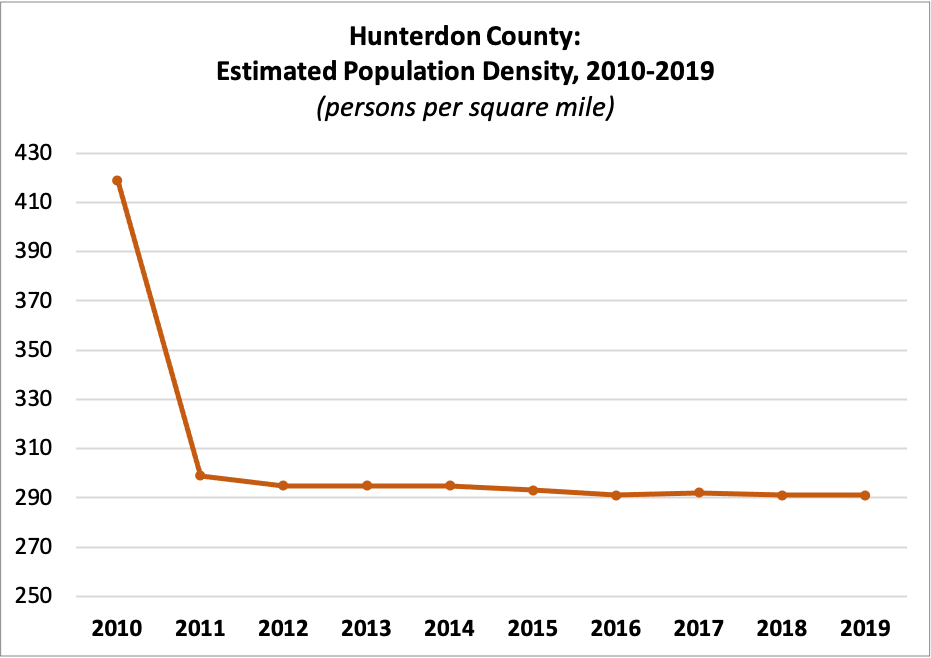
| 2010 | 419 |
| 2011 | 299 |
| 2012 | 295 |
| 2013 | 295 |
| 2014 | 295 |
| 2015 | 293 |
| 2016 | 291 |
| 2017 | 292 |
| 2018 | 291 |
| 2019 | 291 |
Census Population
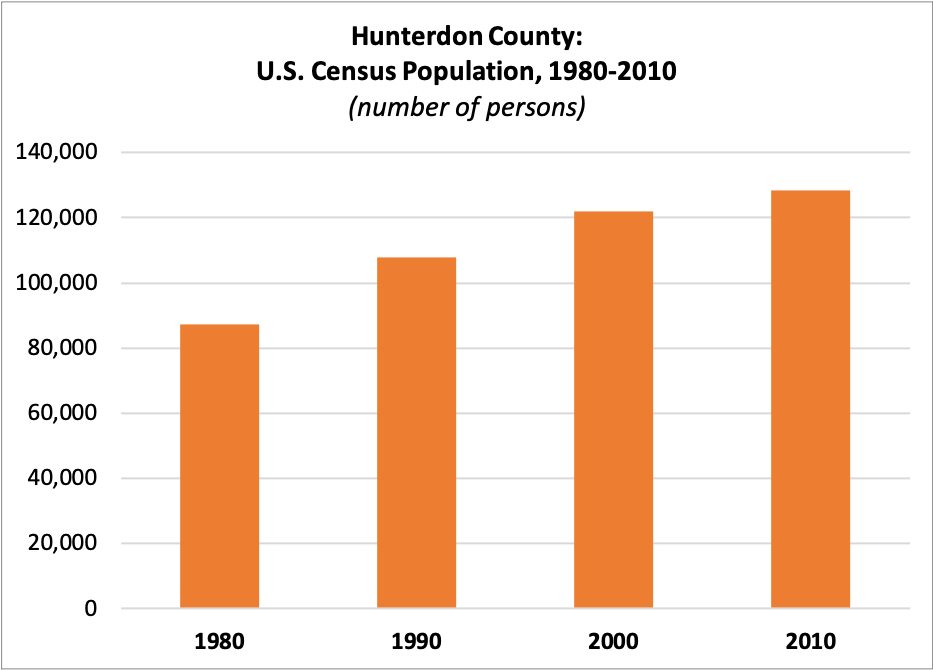
| 1980 | 87,361 |
| 1990 | 107,802 |
| 2000 | 121,989 |
| 2010 | 128,349 |
Estimated Population
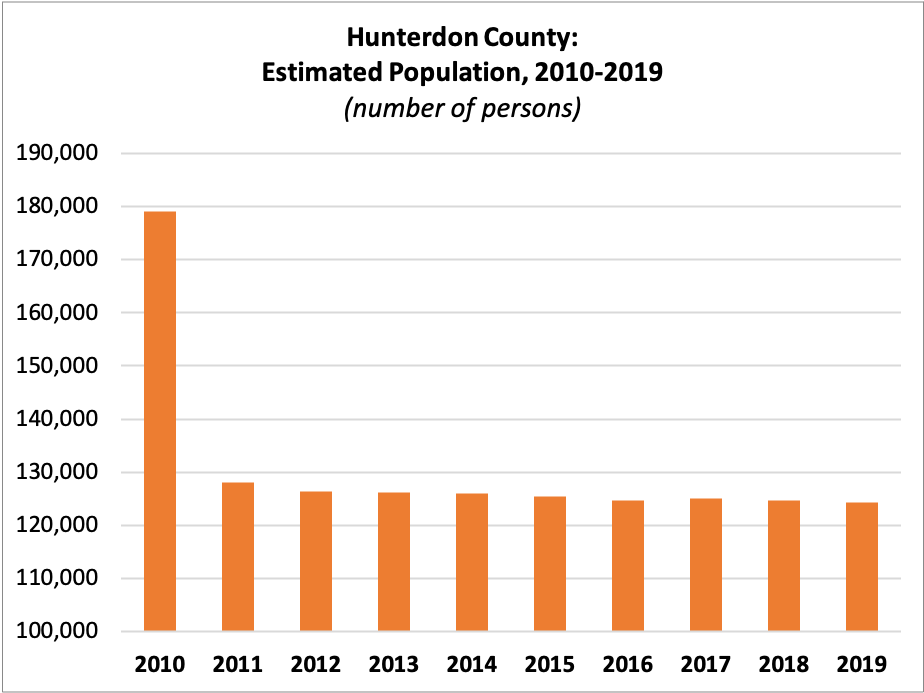
| 2010 | 179,083 |
| 2011 | 128,038 |
| 2012 | 126,388 |
| 2013 | 126,250 |
| 2014 | 126,067 |
| 2015 | 125,488 |
| 2016 | 124,676 |
| 2017 | 125,059 |
| 2018 | 124,714 |
| 2019 | 124,371 |
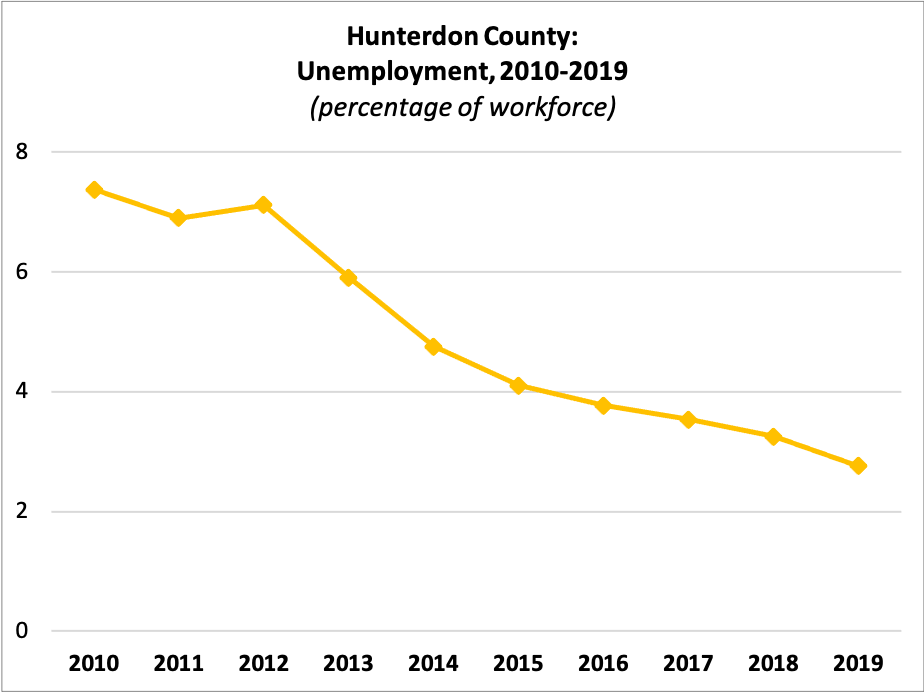
Unemployment
 Workforce:
| 2010 | 68,378 |
| 2011 | 67,838 |
| 2012 | 71,542 |
| 2013 | 69,910 |
| 2014 | 66,368 |
| 2015 | 66,113 |
| 2016 | 65,147 |
| 2017 | 64,723 |
| 2018 | 63,023 |
| 2019 | 64,526 |
Percent Unemployed:
| 2010 | 7.38% |
| 2011 | 6.90% |
| 2012 | 7.12% |
| 2013 | 5.91% |
| 2014 | 4.75% |
| 2015 | 4.10% |
| 2016 | 3.77% |
| 2017 | 3.53% |
| 2018 | 3.25% |
| 2019 | 2.76% |
Median Rent
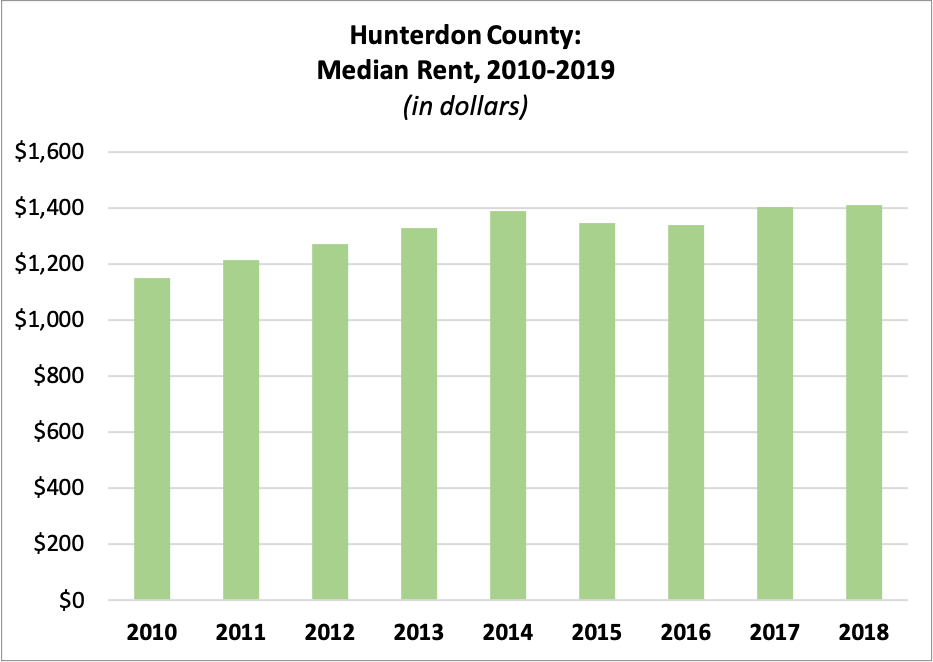
| 2010 | $1,149.92 |
| 2011 | $1,213.26 |
| 2012 | $1,270.62 |
| 2013 | $1,327.53 |
| 2014 | $1,390.43 |
| 2015 | $1,344.95 |
| 2016 | $1,338.38 |
| 2017 | $1,404.80 |
| 2018 | $1,408.96 |
Average Residential Property Value
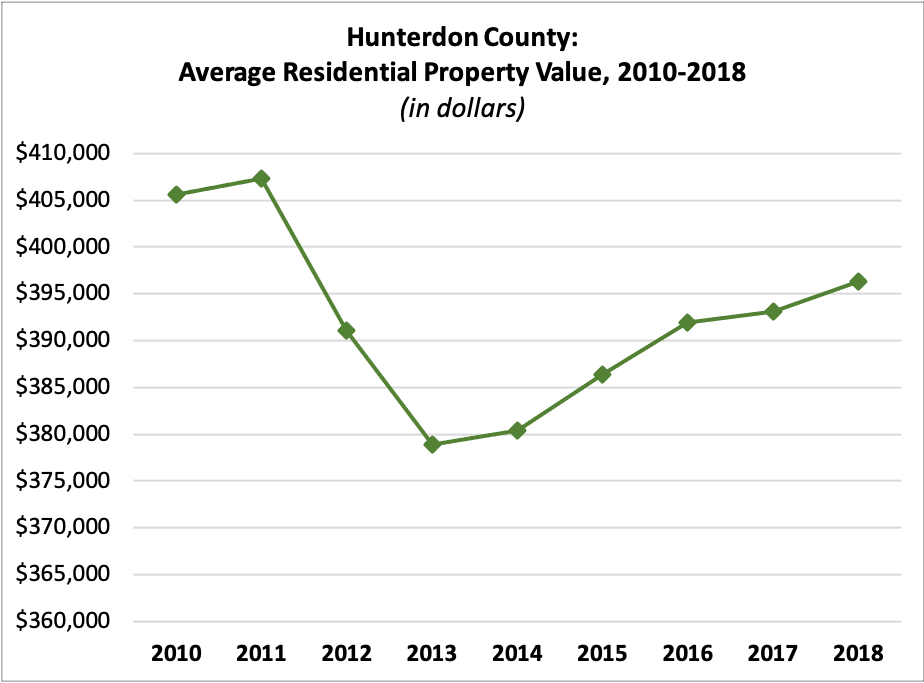
| 2010 | $405,598.63 |
| 2011 | $407,268.16 |
| 2012 | $391,068.79 |
| 2013 | $378,922.97 |
| 2014 | $380,387.11 |
| 2015 | $386,311.71 |
| 2016 | $391,870.64 |
| 2017 | $393,071.53 |
| 2018 | $396,299.32 |
Income per Taxpayer
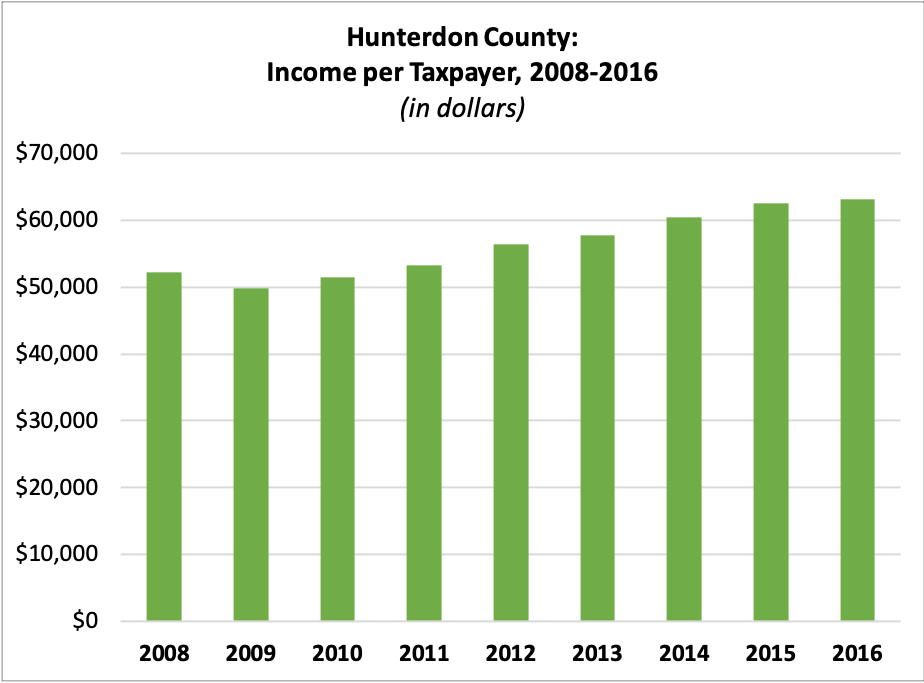
| 2008 | $52,224.54 |
| 2009 | $49,837.62 |
| 2010 | $51,431.57 |
| 2011 | $53,199.42 |
| 2012 | $56,432.88 |
| 2013 | $57,795.36 |
| 2014 | $60,372.22 |
| 2015 | $62,502.34 |
| 2016 | $63,103.12 |
Registered Voters
 Number of Registered Voters
| 2010 | 87,471 |
| 2011 | 87,088 |
| 2012 | 90,699 |
| 2013 | 89,888 |
| 2014 | 91,219 |
| 2015 | 90,547 |
| 2016 | 96,356 |
| 2017 | 96,339 |
| 2018 | 98,598 |
| 2019 | 99,124 |
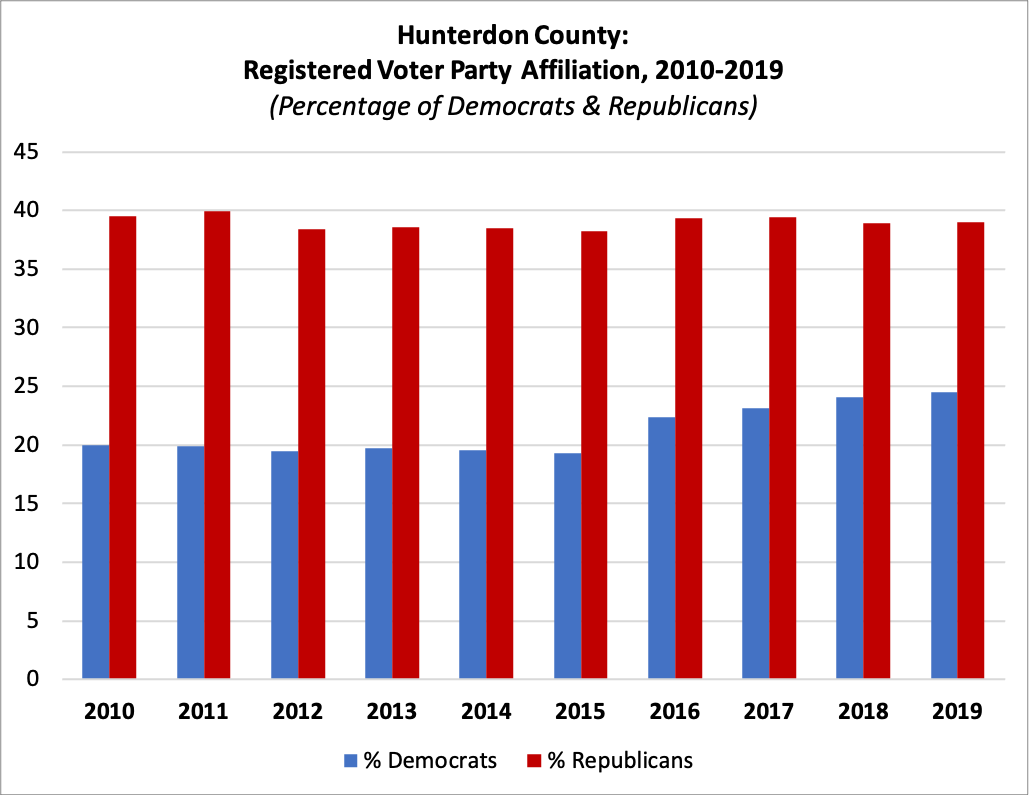
Percent Registered as Democrats
| 2010 | 20.01% |
| 2011 | 19.93% |
| 2012 | 19.48% |
| 2013 | 19.75% |
| 2014 | 19.53% |
| 2015 | 19.27% |
| 2016 | 22.38% |
| 2017 | 23.09% |
| 2018 | 24.10% |
| 2019 | 24.53% |
Percent Registered as Republicans
| 2010 | 39.48% |
| 2011 | 39.96% |
| 2012 | 38.39% |
| 2013 | 38.58% |
| 2014 | 38.46% |
| 2015 | 38.25% |
| 2016 | 39.33% |
| 2017 | 39.44% |
| 2018 | 38.90% |
| 2019 | 38.98% |
For this and more data, visit njdatabook.rutgers.edu!
References
- Burd, et al. (2014), The First 300 Years of Hunterdon County - 1714 to 2014. Retrieved from https://www.co.hunterdon.nj.us/history/300YearsofHistory.pdf
- Fun Facts about Hunterdon County, New Jersey. Hunterdon County, NJ Official Website. Retrieved from https://www.co.hunterdon.nj.us/facts/funfacts.htm