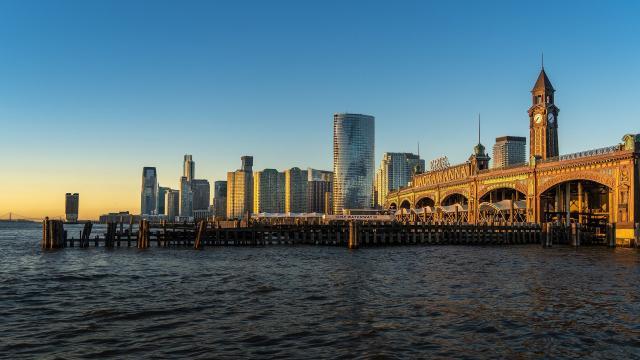
Hudson County is the smallest county in New Jersey according to land area and encompasses 12 municipalities. The county gets its name from the explorer Henry Hudson, who is also the namesake of the Hudson River, which runs along the eastern edge of the county. [1]
Hudson County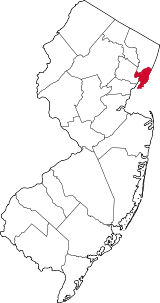
Facts and Figures from the NJ Data Book
Area
46.18 square miles
Density
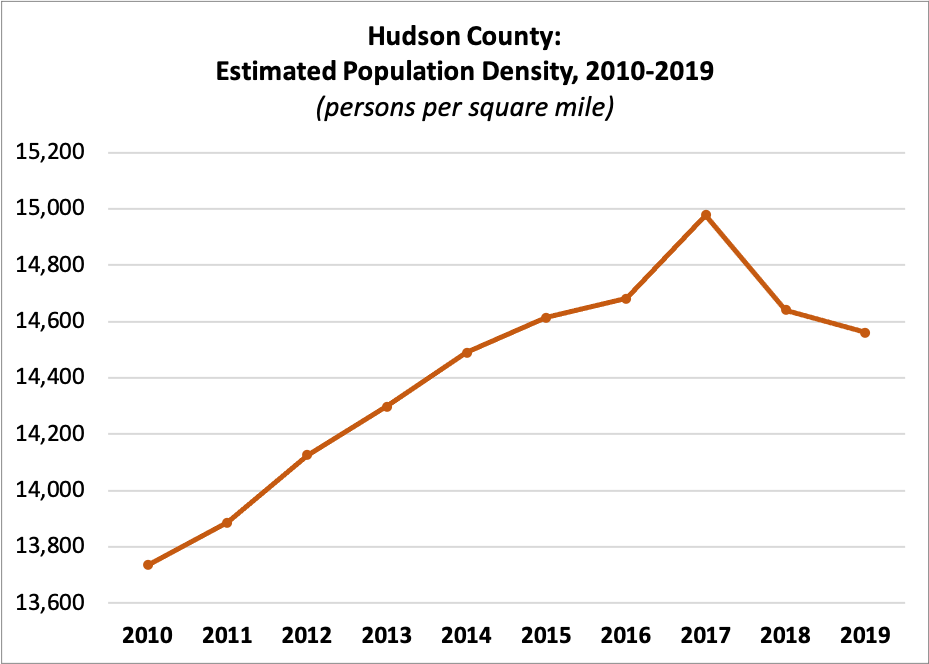
| 2010 | 13,735 |
| 2011 | 13,885 |
| 2012 | 14,125 |
| 2013 | 14,298 |
| 2014 | 14,489 |
| 2015 | 14,613 |
| 2016 | 14,681 |
| 2017 | 14,977 |
| 2018 | 14,640 |
| 2019 | 14,560 |
Census Population
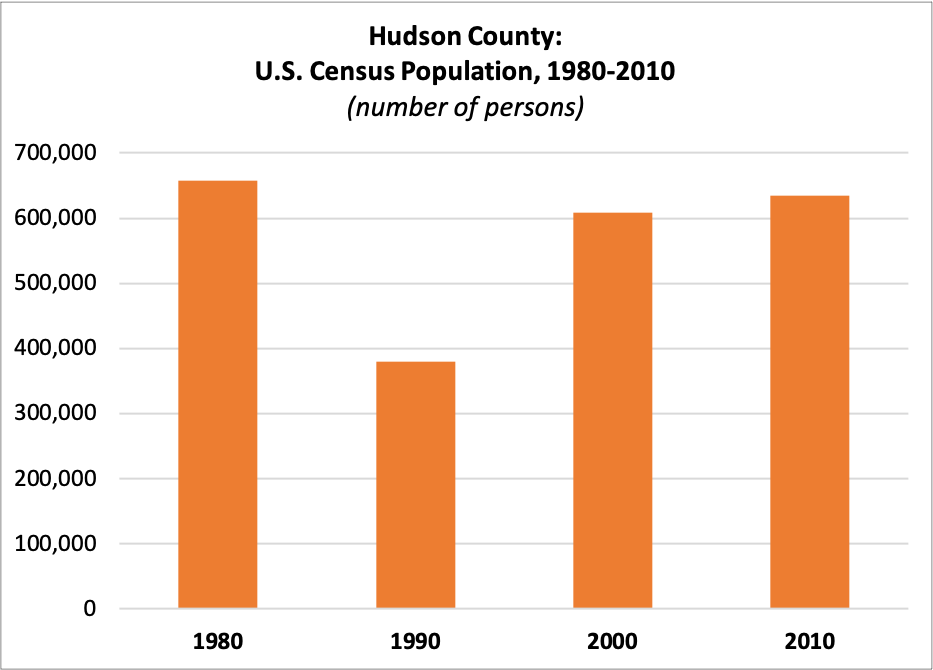
| 1980 | 657,600 |
| 1990 | 379,672 |
| 2000 | 608,975 |
| 2010 | 634,266 |
Estimated Population
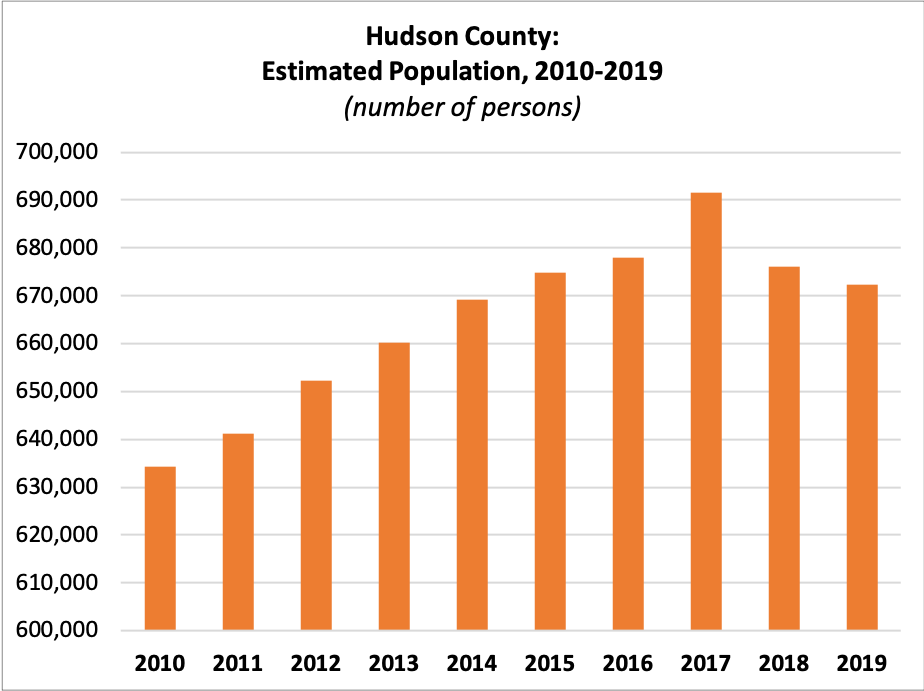
| 2010 | 634,266 |
| 2011 | 641,224 |
| 2012 | 652,302 |
| 2013 | 660,282 |
| 2014 | 669,115 |
| 2015 | 674,836 |
| 2016 | 677,983 |
| 2017 | 691,643 |
| 2018 | 676,061 |
| 2019 | 672,391 |
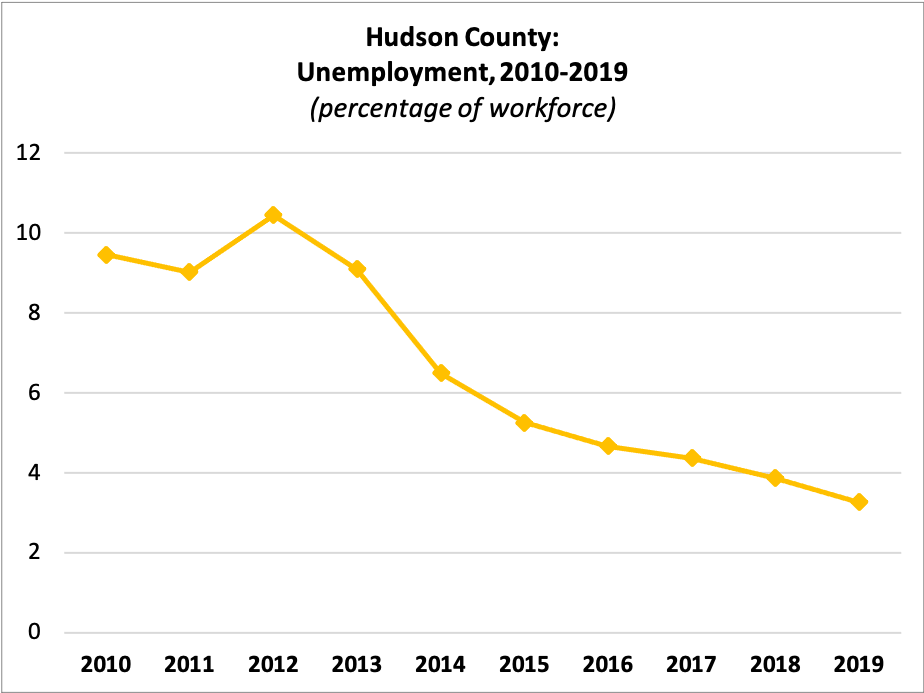
Unemployment
 Workforce:
| 2010 | 352,824 |
| 2011 | 356,449 |
| 2012 | 316,303 |
| 2013 | 312,312 |
| 2014 | 357,862 |
| 2015 | 362,266 |
| 2016 | 361,785 |
| 2017 | 362,644 |
| 2018 | 357,638 |
| 2019 | 361,188 |
Percent Unemployed:
| 2010 | 9.46% |
| 2011 | 9.02% |
| 2012 | 10.45% |
| 2013 | 9.10% |
| 2014 | 6.50% |
| 2015 | 5.26% |
| 2016 | 4.67% |
| 2017 | 4.37% |
| 2018 | 3.87% |
| 2019 | 3.27% |
Median Rent
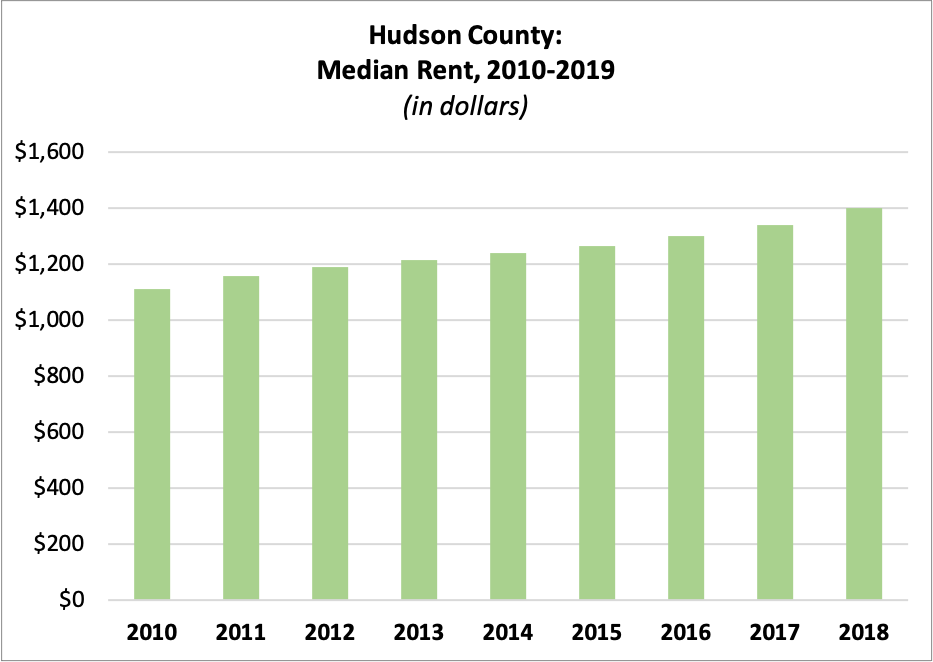
| 2010 | $1,109.24 |
| 2011 | $1,158.51 |
| 2012 | $1,190.48 |
| 2013 | $1,212.96 |
| 2014 | $1,238.70 |
| 2015 | $1,264.02 |
| 2016 | $1,300.87 |
| 2017 | $1,339.59 |
| 2018 | $1,399.74 |
Average Residential Property Value
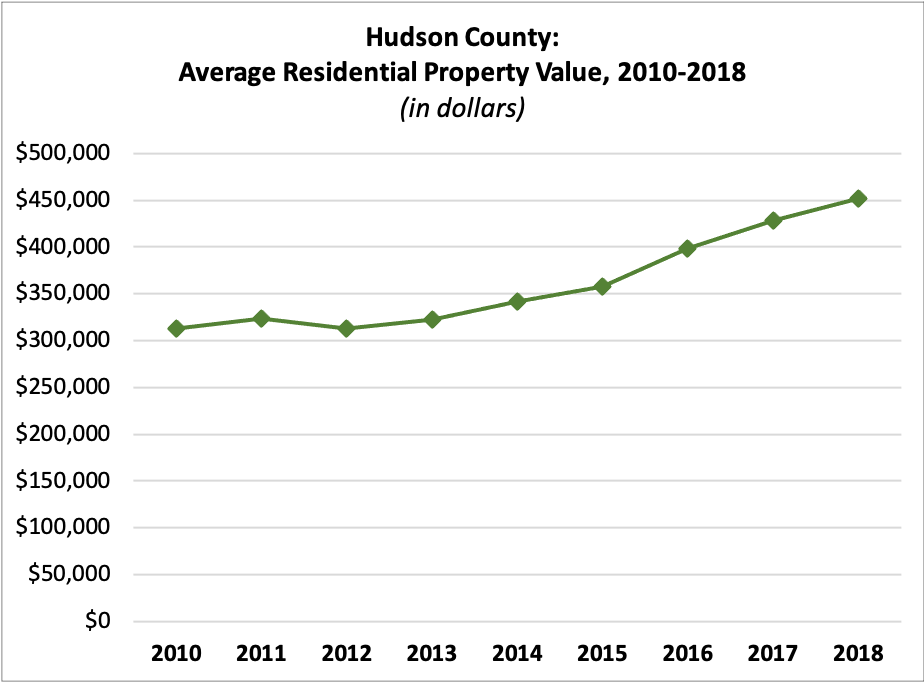
| 2010 | $312,925.49 |
| 2011 | $323,619.59 |
| 2012 | $312,584.24 |
| 2013 | $322,378.70 |
| 2014 | $341,330.84 |
| 2015 | $357,981.73 |
| 2016 | $398,113.32 |
| 2017 | $427,892.29 |
| 2018 | $452,114.48 |
Income per Taxpayer
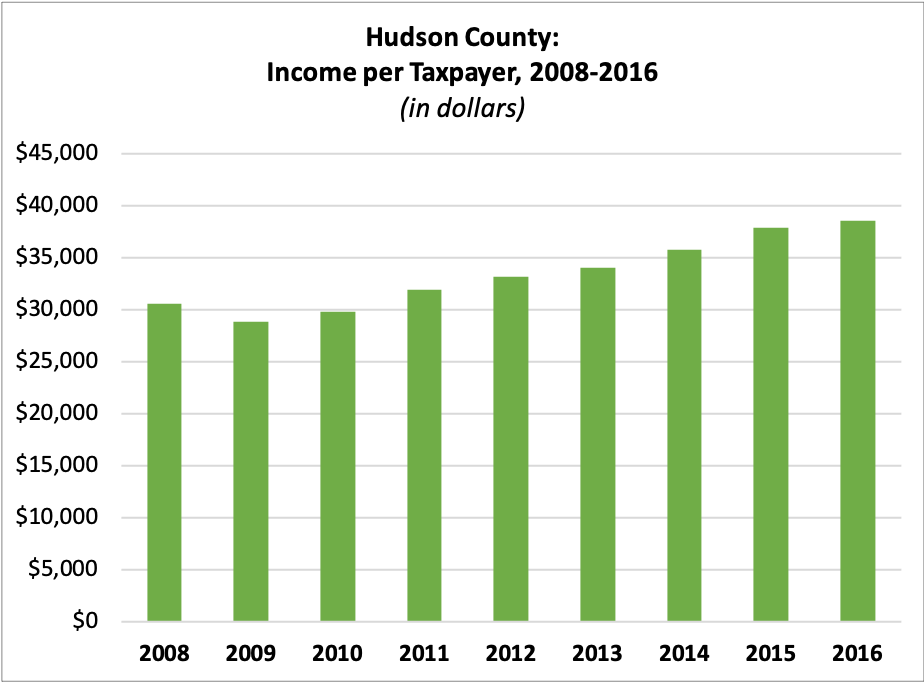
| 2008 | $30,567.62 |
| 2009 | $28,852.81 |
| 2010 | $29,791.32 |
| 2011 | $31,870.59 |
| 2012 | $33,131.82 |
| 2013 | $33,949.97 |
| 2014 | $35,742.72 |
| 2015 | $37,822.82 |
| 2016 | $38,528.53 |
Registered Voters
 Number of Registered Voters
| 2010 | 311,481 |
| 2011 | 317,265 |
| 2012 | 341,253 |
| 2013 | 351,620 |
| 2014 | 317,977 |
| 2015 | 311,500 |
| 2016 | 347,277 |
| 2017 | 346,703 |
| 2018 | 364,056 |
| 2019 | 382,973 |
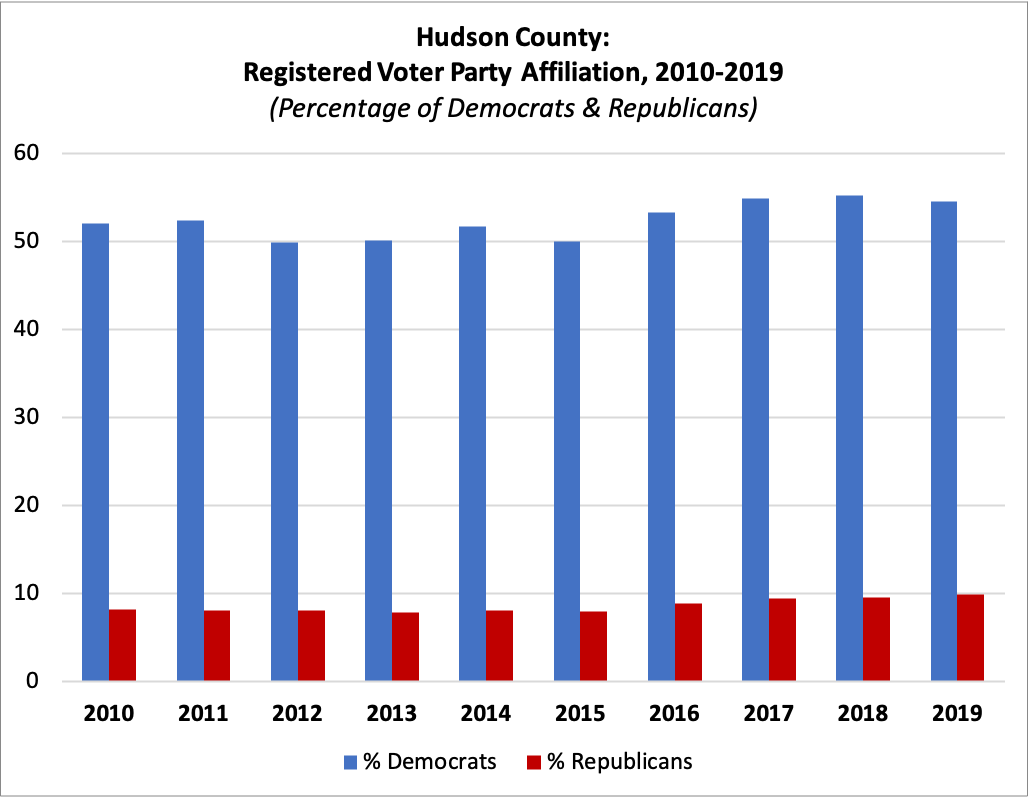
Percent Registered as Democrats
| 2010 | 52.02% |
| 2011 | 52.35% |
| 2012 | 49.85% |
| 2013 | 50.12% |
| 2014 | 51.69% |
| 2015 | 49.99% |
| 2016 | 53.24% |
| 2017 | 54.88% |
| 2018 | 55.21% |
| 2019 | 54.50% |
Percent Registered as Republicans
| 2010 | 8.17% |
| 2011 | 8.06% |
| 2012 | 7.97% |
| 2013 | 7.83% |
| 2014 | 8.00% |
| 2015 | 7.90% |
| 2016 | 8.79% |
| 2017 | 9.35% |
| 2018 | 9.54% |
| 2019 | 9.81% |
For this and more data, visit njdatabook.rutgers.edu!
References
1. Municipalities. Hudson County, NJ Official Website. Retrieved from https://www.hudsoncountynj.org/hudson-municipalities.