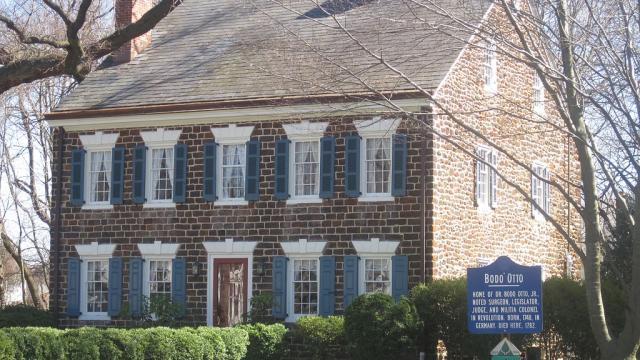
Gloucester County is made up of 24 municipalities and ranks 11th in the state for land area. The county was founded in 1686 and has roots in the agricultural industry. It is still one of the main food-producing areas of not only the state, but the country. [1]
Gloucester County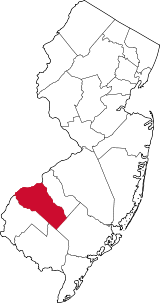
Facts and Figures from the NJ Data Book
Area
321.99 square miles
Density
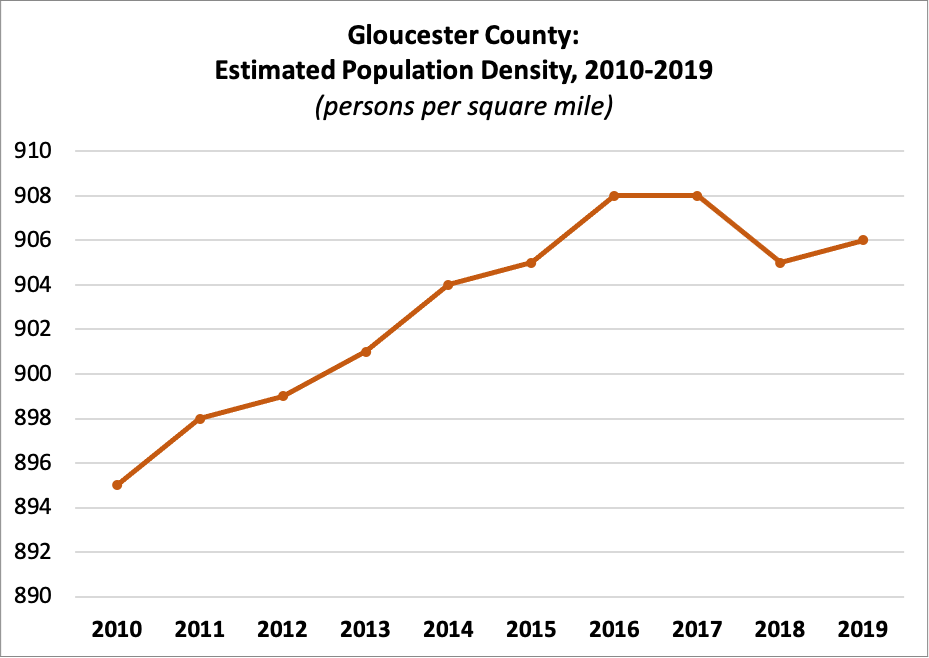
| 2010 | 895 |
| 2011 | 898 |
| 2012 | 899 |
| 2013 | 901 |
| 2014 | 904 |
| 2015 | 905 |
| 2016 | 908 |
| 2017 | 908 |
| 2018 | 905 |
| 2019 | 906 |
Census Population
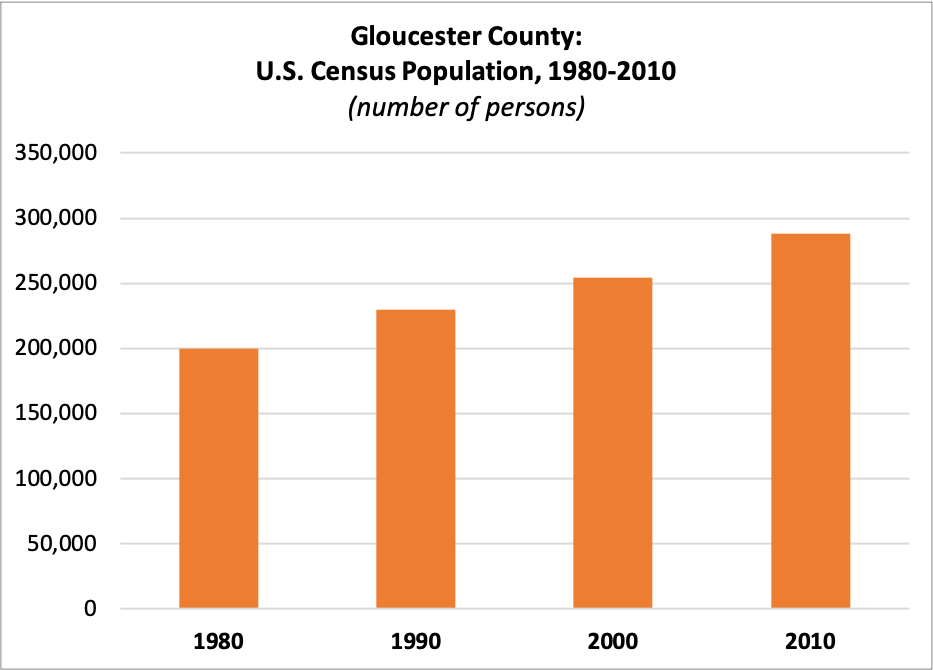
| 1980 | 199,917 |
| 1990 | 230,082 |
| 2000 | 254,673 |
| 2010 | 288,288 |
Estimated Population
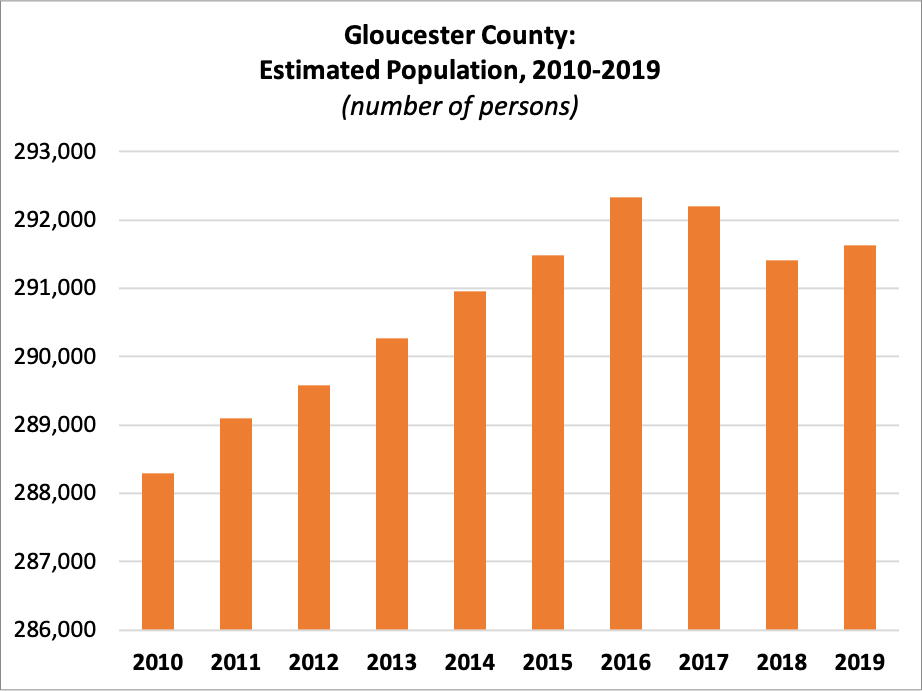
| 2010 | 288,288 |
| 2011 | 289,104 |
| 2012 | 289,586 |
| 2013 | 290,265 |
| 2014 | 290,951 |
| 2015 | 291,479 |
| 2016 | 292,330 |
| 2017 | 292,206 |
| 2018 | 291,408 |
| 2019 | 291,636 |
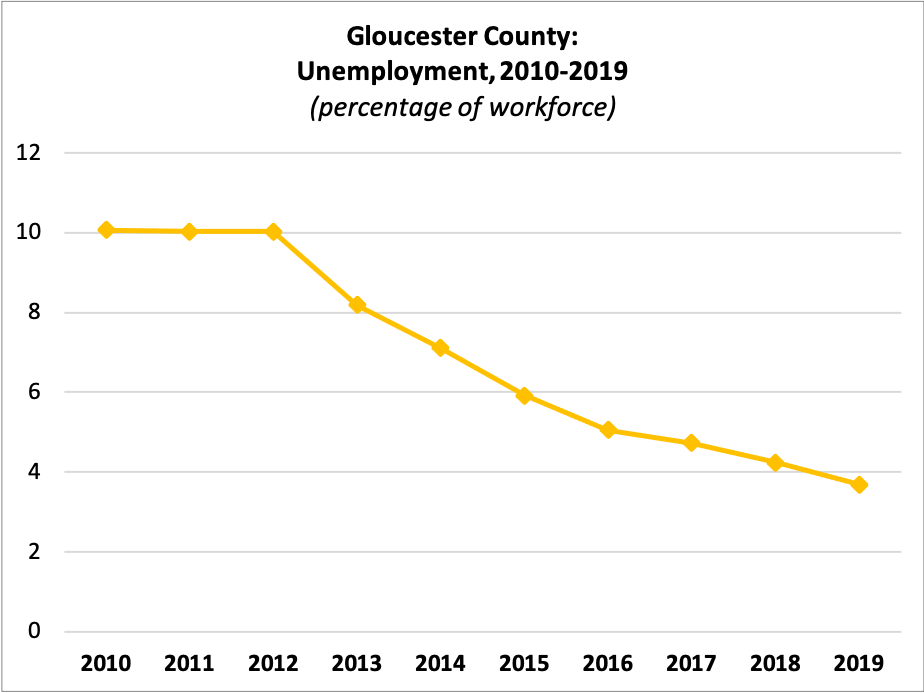
Unemployment
 Workforce:
| 2010 | 152,107 |
| 2011 | 150,884 |
| 2012 | 158,777 |
| 2013 | 155,563 |
| 2014 | 148,820 |
| 2015 | 149,658 |
| 2016 | 150,049 |
| 2017 | 151,565 |
| 2018 | 147,172 |
| 2019 | 149,741 |
Percent Unemployed:
| 2010 | 10.06% |
| 2011 | 10.02% |
| 2012 | 10.02% |
| 2013 | 8.18% |
| 2014 | 7.10% |
| 2015 | 5.92% |
| 2016 | 5.05% |
| 2017 | 4.72% |
| 2018 | 4.23% |
| 2019 | 3.68% |
Median Rent
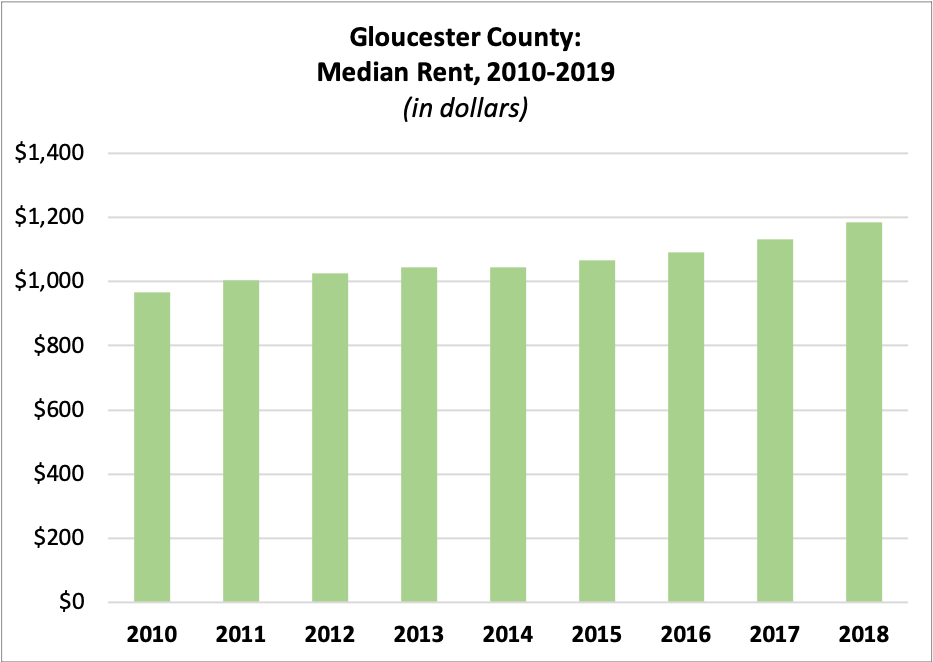
| 2010 | $967.22 |
| 2011 | $1,003.66 |
| 2012 | $1,026.54 |
| 2013 | $1,044.80 |
| 2014 | $1,044.72 |
| 2015 | $1,065.51 |
| 2016 | $1,093.19 |
| 2017 | $1,133.13 |
| 2018 | $1,184.33 |
Average Residential Property Value
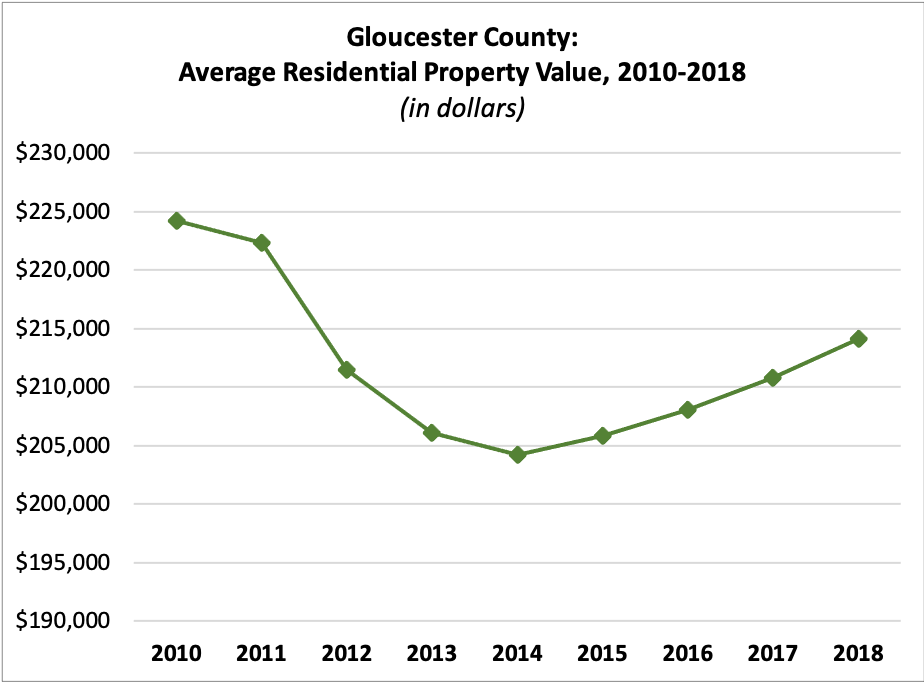
| 2010 | $224,195.16 |
| 2011 | $222,339.39 |
| 2012 | $211,452.05 |
| 2013 | $206,124.17 |
| 2014 | $204,265.02 |
| 2015 | $205,831.40 |
| 2016 | $208,118.32 |
| 2017 | $210,852.55 |
| 2018 | $214,164.94 |
Income per Taxpayer
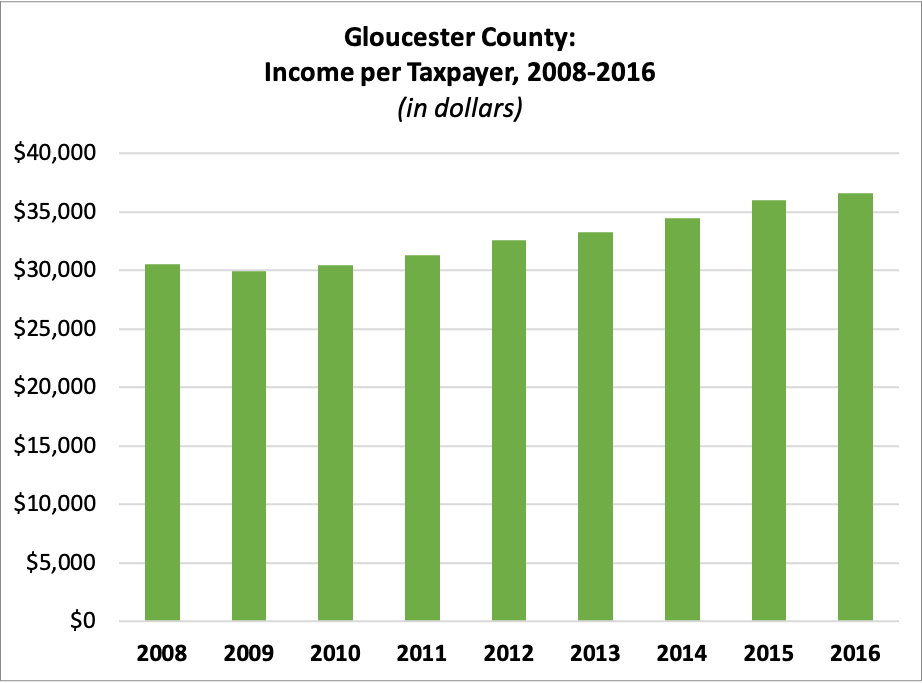
| 2008 | $30,490.64 |
| 2009 | $29,917.43 |
| 2010 | $30,447.75 |
| 2011 | $31,319.73 |
| 2012 | $32,606.50 |
| 2013 | $33,217.26 |
| 2014 | $34,462.77 |
| 2015 | $36,006.93 |
| 2016 | $36,612.65 |
Registered Voters
 Number of Registered Voters
| 2010 | 191,666 |
| 2011 | 187,791 |
| 2012 | 196,471 |
| 2013 | 193,820 |
| 2014 | 196,386 |
| 2015 | 198,313 |
| 2016 | 206,503 |
| 2017 | 206,681 |
| 2018 | 213,521 |
| 2019 | 213,475 |
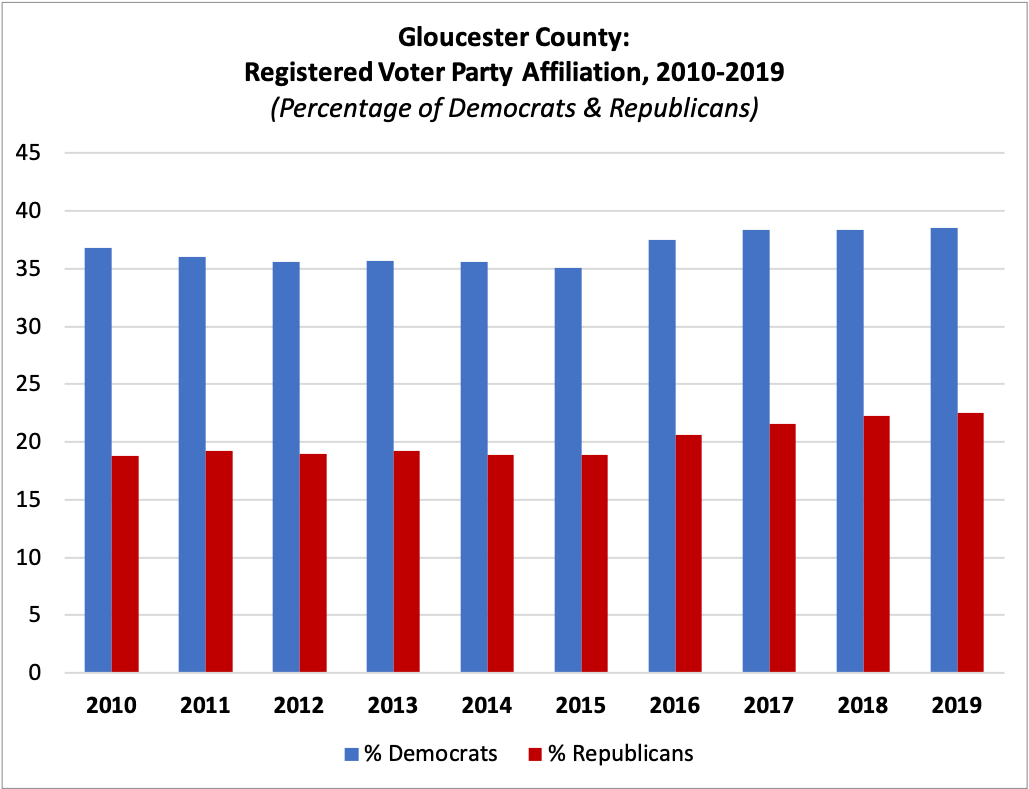
Percent Registered as Democrats
| 2010 | 36.80% |
| 2011 | 36.07% |
| 2012 | 35.58% |
| 2013 | 35.66% |
| 2014 | 35.62% |
| 2015 | 35.11% |
| 2016 | 37.52% |
| 2017 | 38.33% |
| 2018 | 38.38% |
| 2019 | 38.55% |
Percent Registered as Republicans
| 2010 | 18.79% |
| 2011 | 19.21% |
| 2012 | 18.95% |
| 2013 | 19.19% |
| 2014 | 18.89% |
| 2015 | 18.85% |
| 2016 | 20.66% |
| 2017 | 21.57% |
| 2018 | 22.27% |
| 2019 | 22.51% |
For this and more data, visit njdatabook.rutgers.edu!
References
1. County History. Gloucester County, NJ Official Website. Retrieved from https://www.gloucestercountynj.gov/792/County-History.