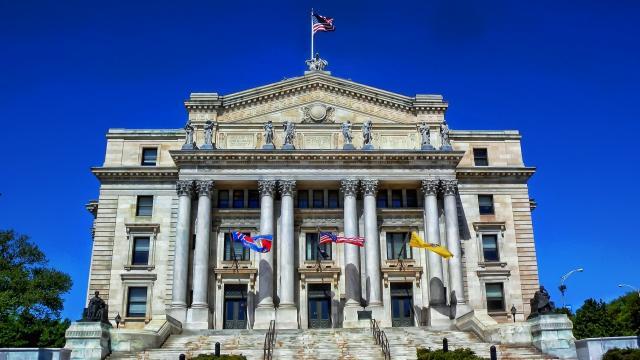
Essex County is the third-smallest county by land area in the state of New Jersey. It is comprised of 22 municipalities. It was established as one of the first four counties, along with Bergen, Monmouth and Middlesex, in 1682. The Essex County Parks Commission was formed in 1895 and was the first county in the United States to create a countywide park system. [1]
Essex County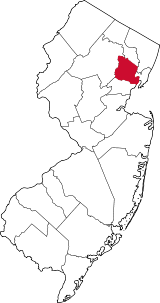
Facts and Figures from the NJ Data Book
Area
126.22 square miles
Density
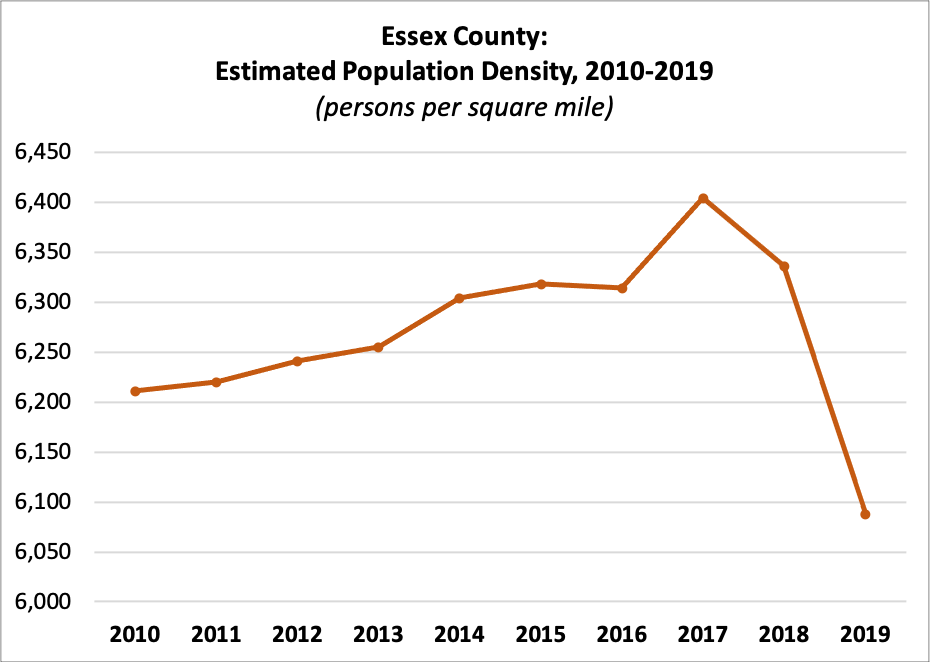
| 2010 | 6,211 |
| 2011 | 6,220 |
| 2012 | 6,241 |
| 2013 | 6,255 |
| 2014 | 6,304 |
| 2015 | 6,318 |
| 2016 | 6,314 |
| 2017 | 6,404 |
| 2018 | 6,336 |
| 2019 | 6,088 |
Census Population
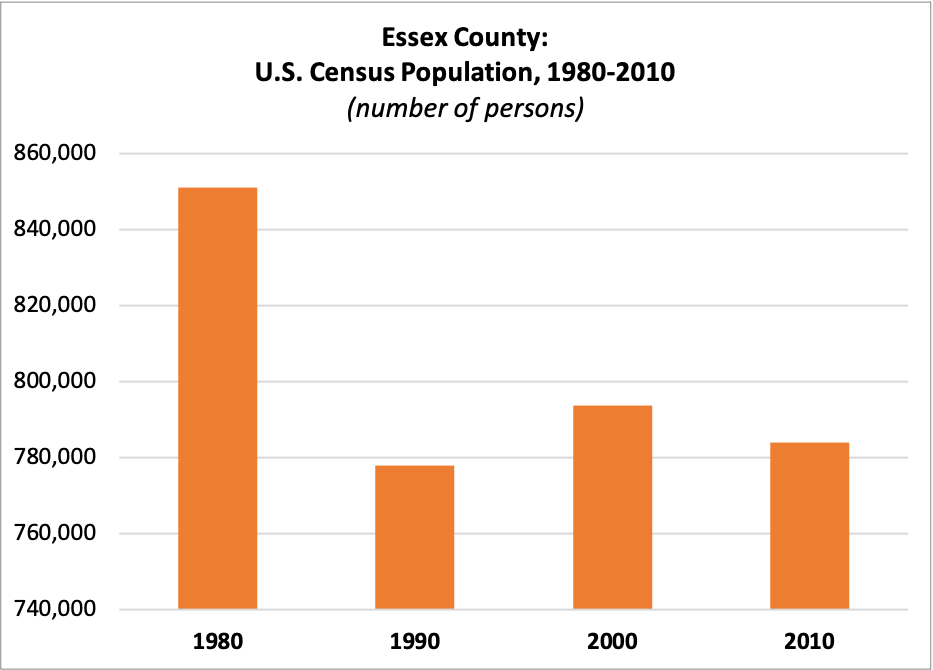
| 1980 | 851,116 |
| 1990 | 777,964 |
| 2000 | 793,633 |
| 2010 | 783,969 |
Estimated Population
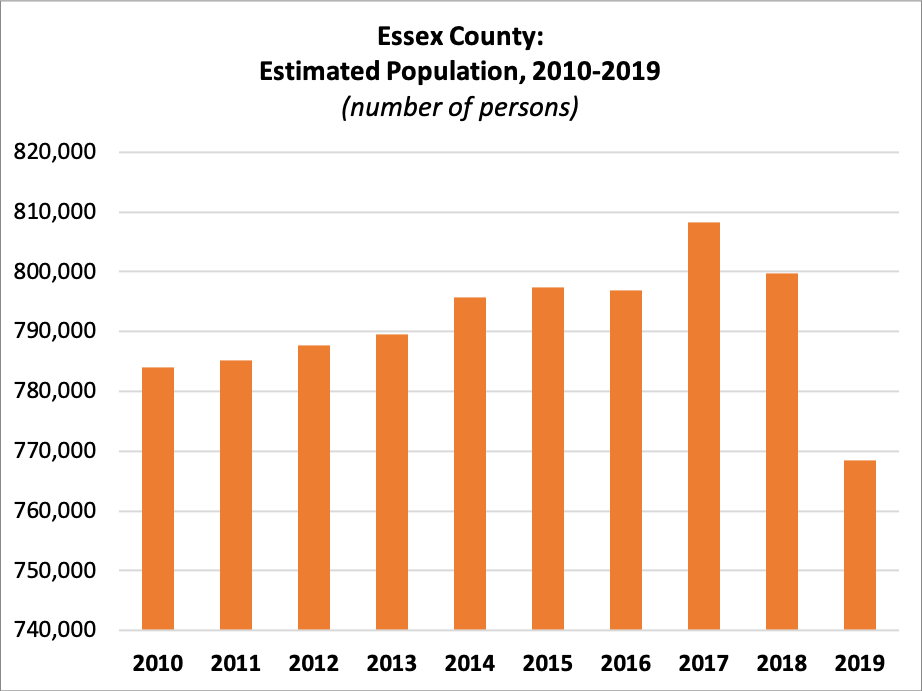
| 2010 | 783,969 |
| 2011 | 785,137 |
| 2012 | 787,744 |
| 2013 | 789,565 |
| 2014 | 795,723 |
| 2015 | 797,434 |
| 2016 | 796,914 |
| 2017 | 808,285 |
| 2018 | 799,767 |
| 2019 | 768,424 |
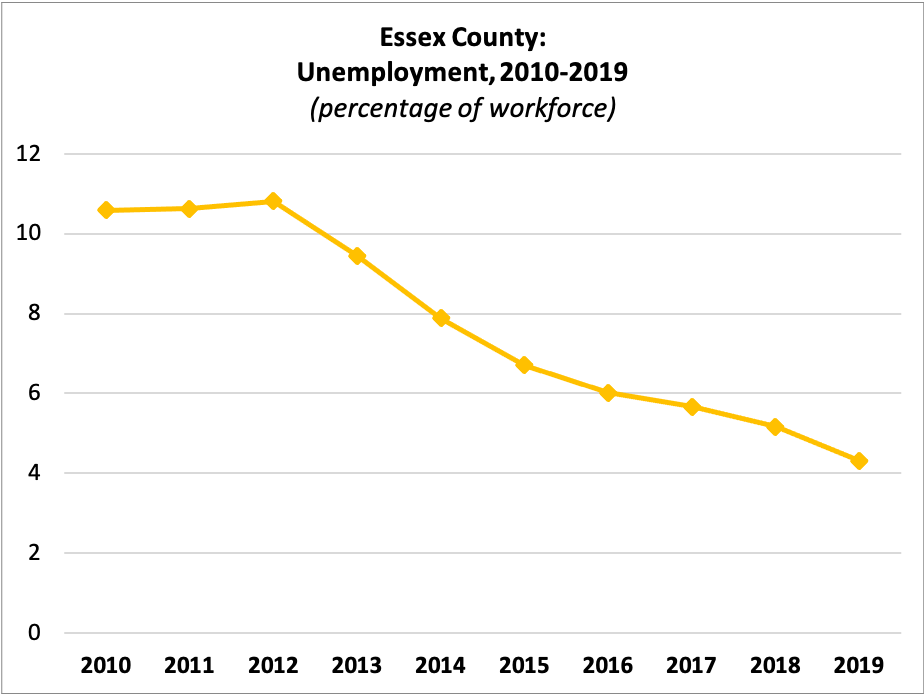
Unemployment
 Workforce:
| 2010 | 381,129 |
| 2011 | 381,651 |
| 2012 | 372,133 |
| 2013 | 361,157 |
| 2014 | 375,865 |
| 2015 | 375,628 |
| 2016 | 371,131 |
| 2017 | 370,499 |
| 2018 | 364,347 |
| 2019 | 339,463 |
Percent Unemployed:
| 2010 | 10.59% |
| 2011 | 10.62% |
| 2012 | 10.81% |
| 2013 | 9.45% |
| 2014 | 7.88% |
| 2015 | 6.71% |
| 2016 | 6.02% |
| 2017 | 5.67% |
| 2018 | 5.17% |
| 2019 | 4.31% |
Median Rent
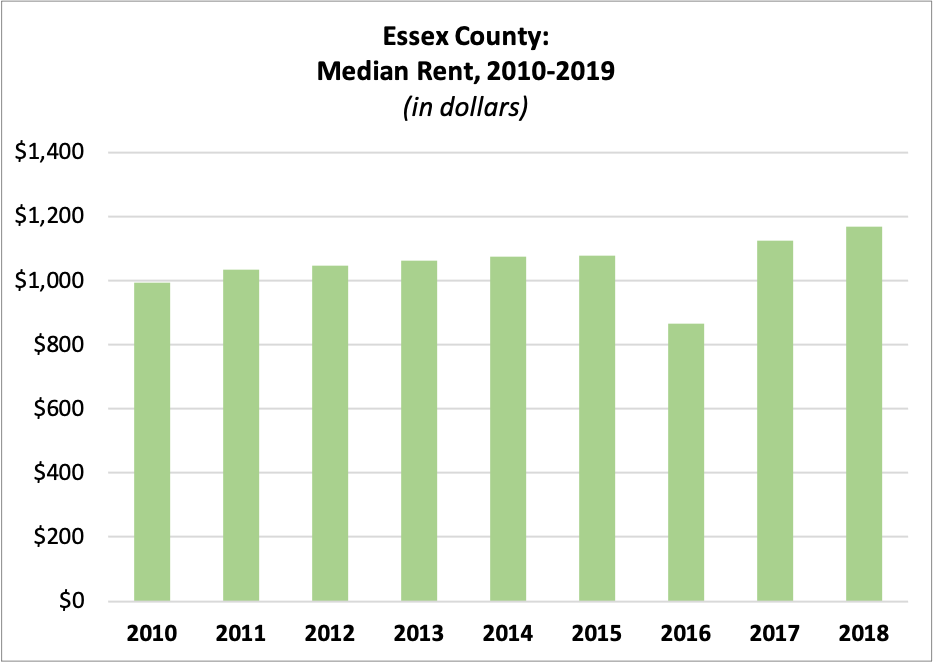
| 2010 | $992.58 |
| 2011 | $1,033.25 |
| 2012 | $1,046.82 |
| 2013 | $1,063.94 |
| 2014 | $1,076.72 |
| 2015 | $1,078.71 |
| 2016 | $866.45 |
| 2017 | $1,125.55 |
| 2018 | $1,169.63 |
Average Residential Property Value
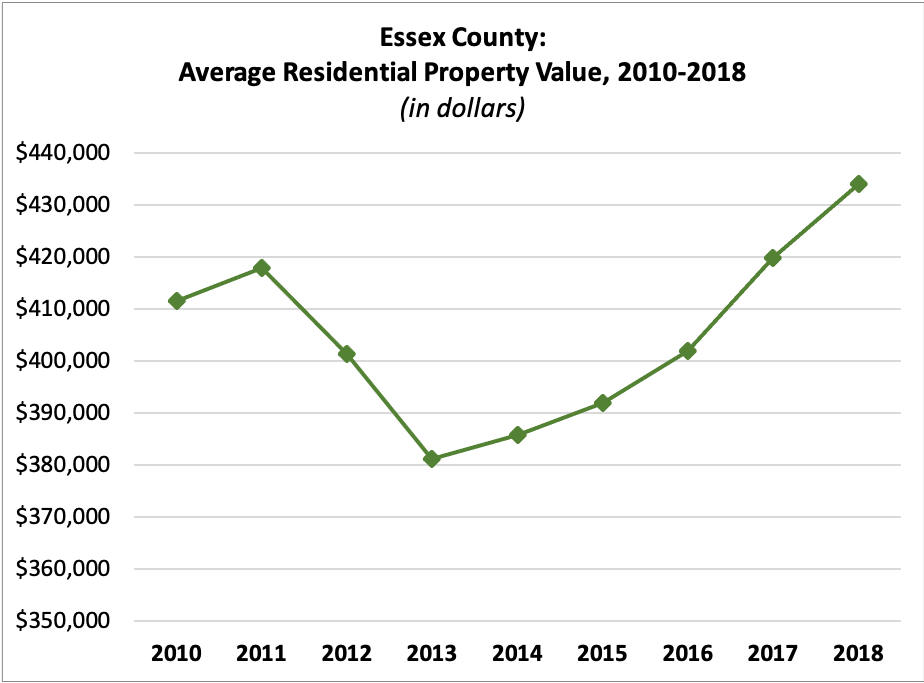
| 2010 | $411,650.40 |
| 2011 | $417,967.37 |
| 2012 | $401,327.25 |
| 2013 | $381,128.65 |
| 2014 | $385,738.68 |
| 2015 | $392,062.57 |
| 2016 | $401,903.91 |
| 2017 | $419,784.44 |
| 2018 | $434,138.68 |
Income per Taxpayer
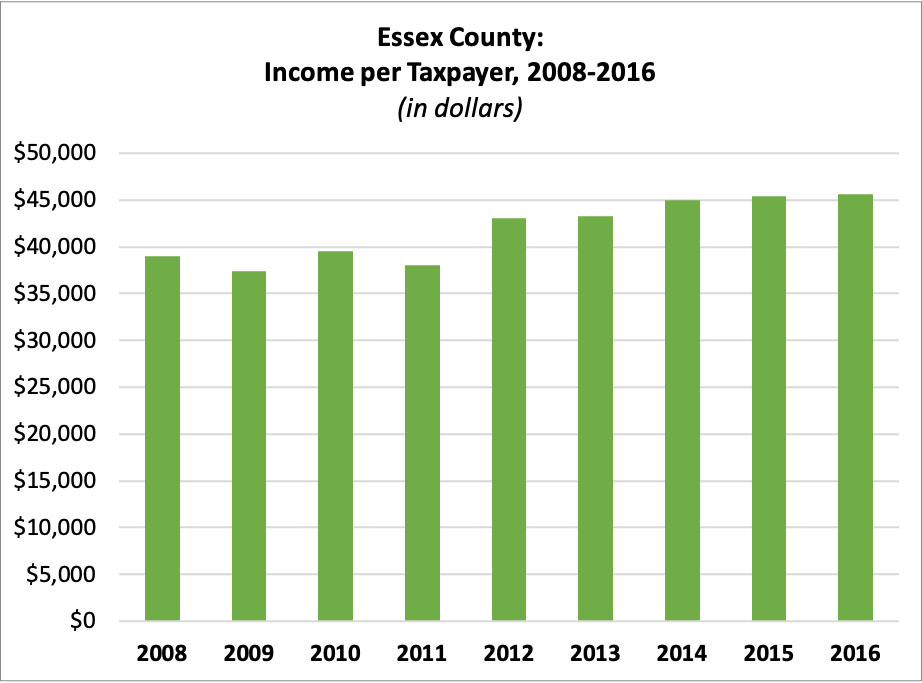
| 2008 | $39,025.16 |
| 2009 | $37,388.45 |
| 2010 | $39,557.78 |
| 2011 | $38,028.85 |
| 2012 | $43,096.12 |
| 2013 | $43,327.28 |
| 2014 | $45,038.90 |
| 2015 | $45,412.59 |
| 2016 | $45,636.39 |
Registered Voters
 Number of Registered Voters
| 2010 | 456,368 |
| 2011 | 451,561 |
| 2012 | 484,211 |
| 2013 | 493,219 |
| 2014 | 488,341 |
| 2015 | 491,439 |
| 2016 | 534,447 |
| 2017 | 491,010 |
| 2018 | 510,206 |
| 2019 | 532,625 |
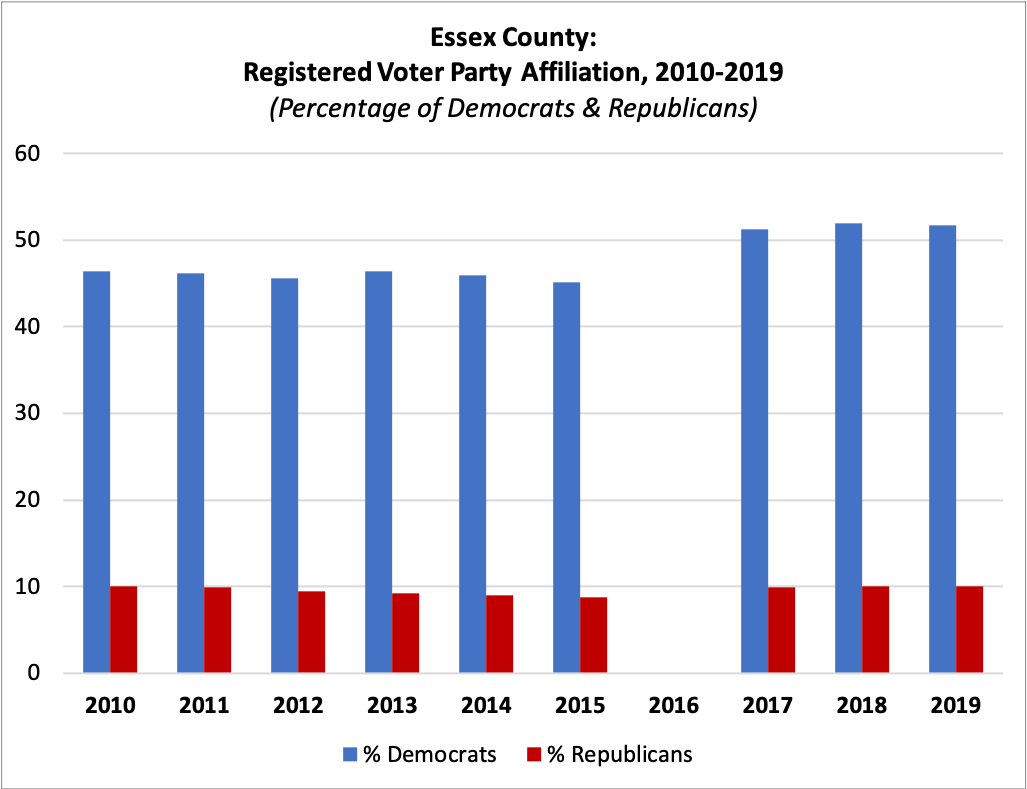
Percent Registered as Democrats
| 2010 | 46.37% |
| 2011 | 46.17% |
| 2012 | 45.55% |
| 2013 | 46.46% |
| 2014 | 45.92% |
| 2015 | 45.12% |
| 2016 | N/A |
| 2017 | 51.24% |
| 2018 | 51.93% |
| 2019 | 51.73% |
Percent Registered as Republicans
| 2010 | 10.04% |
| 2011 | 9.93% |
| 2012 | 9.47% |
| 2013 | 9.27% |
| 2014 | 8.99% |
| 2015 | 8.78% |
| 2016 | N/A |
| 2017 | 9.93% |
| 2018 | 10.02% |
| 2019 | 9.98% |
For this and more data, visit njdatabook.rutgers.edu!
References
History of Essex County, NJ. Essex County, NJ Official Website. Retrieved from https://essexcountynj.org/history/.