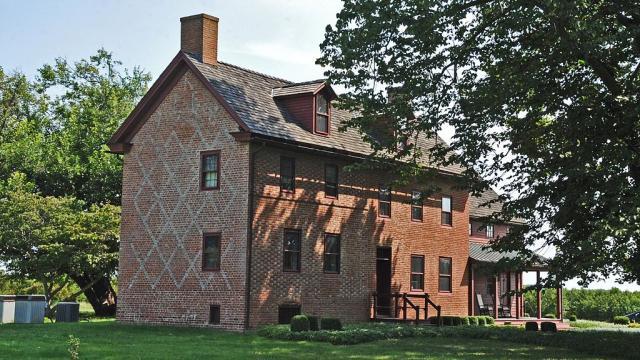
Cumberland County encompasses 14 municipalities and is the fifth-largest county by land area. The county was founded in 1748. Port Norris (part of Commercial Township) was once known as the “Oyster Capital of the World” and was once of the four leading oyster-producing states in the nation. [1]
Cumberland County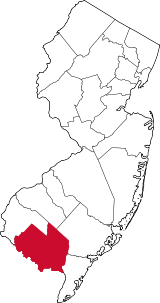
Facts and Figures from the NJ Data Book
Area
483.71 square miles
Density
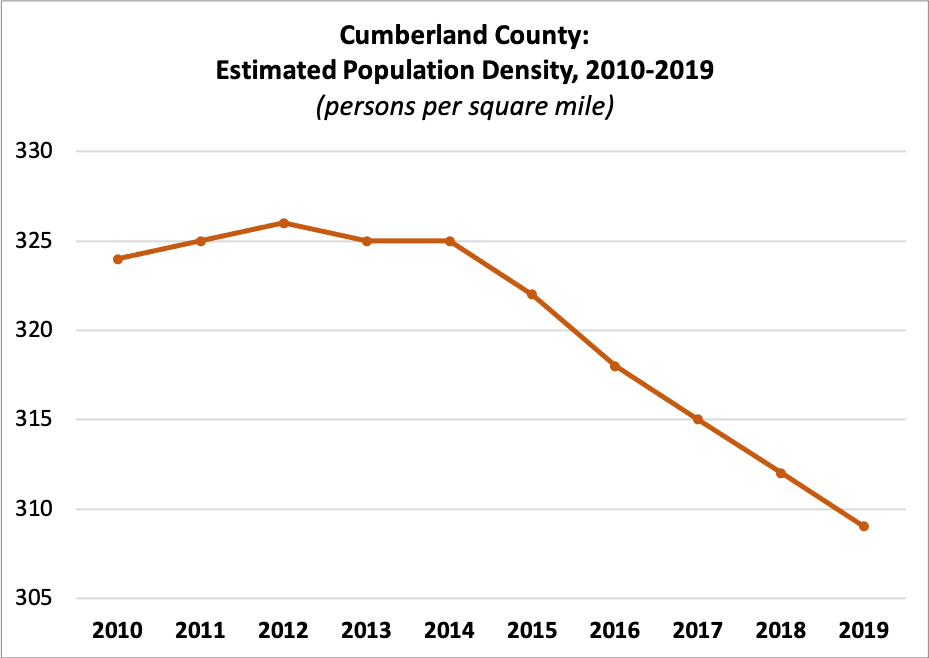
| 2010 | 324 |
| 2011 | 325 |
| 2012 | 326 |
| 2013 | 325 |
| 2014 | 325 |
| 2015 | 322 |
| 2016 | 318 |
| 2017 | 315 |
| 2018 | 312 |
| 2019 | 309 |
Census Population
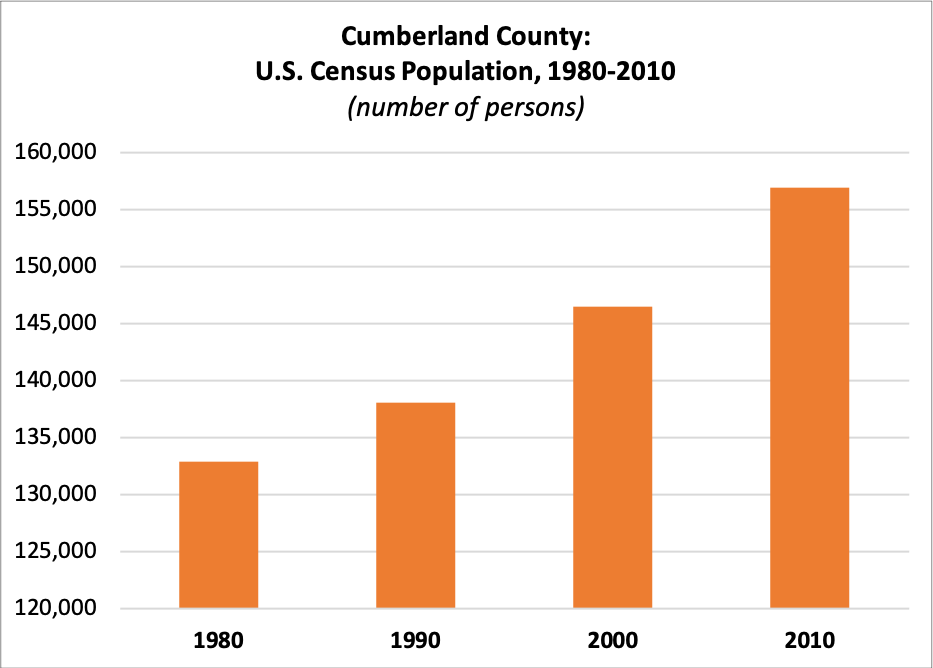
| 1980 | 132,866 |
| 1990 | 138,053 |
| 2000 | 146,438 |
| 2010 | 156,898 |
Estimated Population
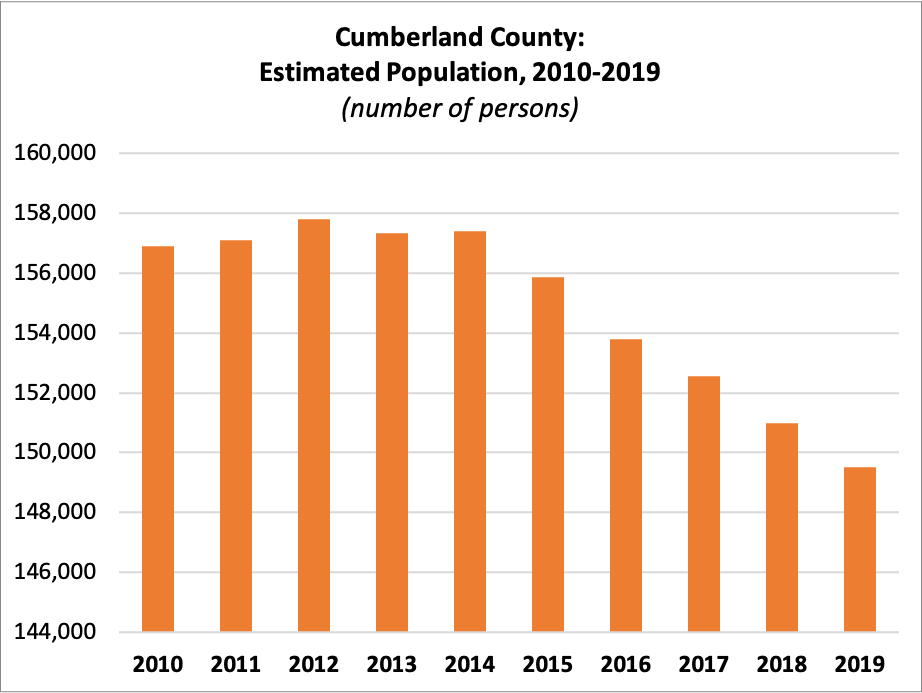
| 2010 | 156,898 |
| 2011 | 157,095 |
| 2012 | 157,785 |
| 2013 | 157,332 |
| 2014 | 157,389 |
| 2015 | 155,854 |
| 2016 | 153,797 |
| 2017 | 152,538 |
| 2018 | 150,972 |
| 2019 | 149,527 |
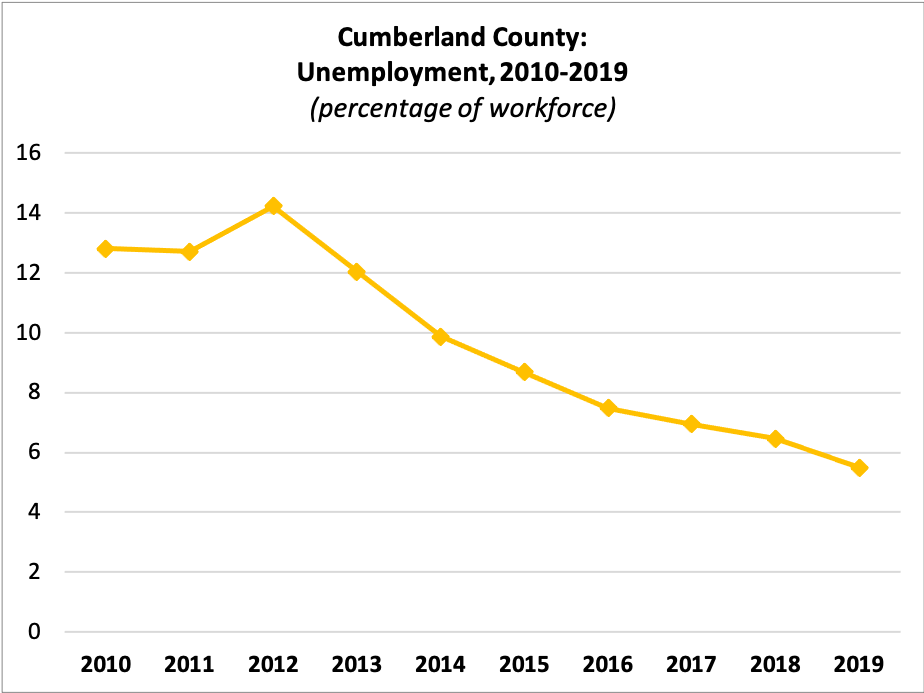
Unemployment
 Workforce:
| 2010 | 73,072 |
| 2011 | 71,854 |
| 2012 | 69,643 |
| 2013 | 67,512 |
| 2014 | 67,162 |
| 2015 | 67,386 |
| 2016 | 67,210 |
| 2017 | 66,407 |
| 2018 | 64,288 |
| 2019 | 65,060 |
Percent Unemployed:
| 2010 | 12.82% |
| 2011 | 12.71% |
| 2012 | 14.23% |
| 2013 | 12.04% |
| 2014 | 9.87% |
| 2015 | 8.68% |
| 2016 | 7.48% |
| 2017 | 6.95% |
| 2018 | 6.47% |
| 2019 | 5.50% |
Median Rent
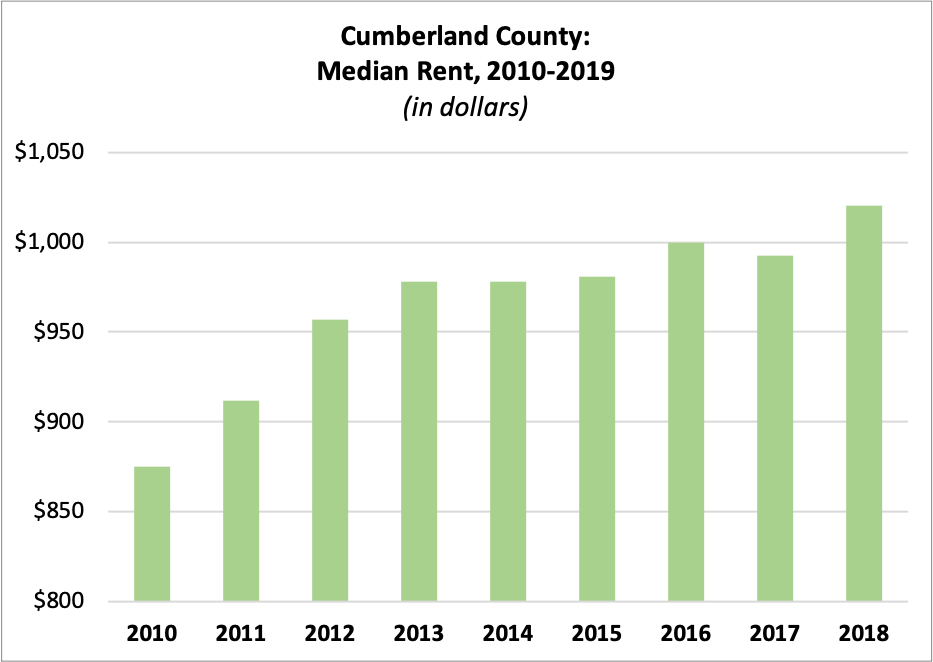
| 2010 | $874.83 |
| 2011 | $911.82 |
| 2012 | $956.65 |
| 2013 | $977.99 |
| 2014 | $977.90 |
| 2015 | $980.82 |
| 2016 | $999.98 |
| 2017 | $992.37 |
| 2018 | $1,020.68 |
Average Residential Property Value
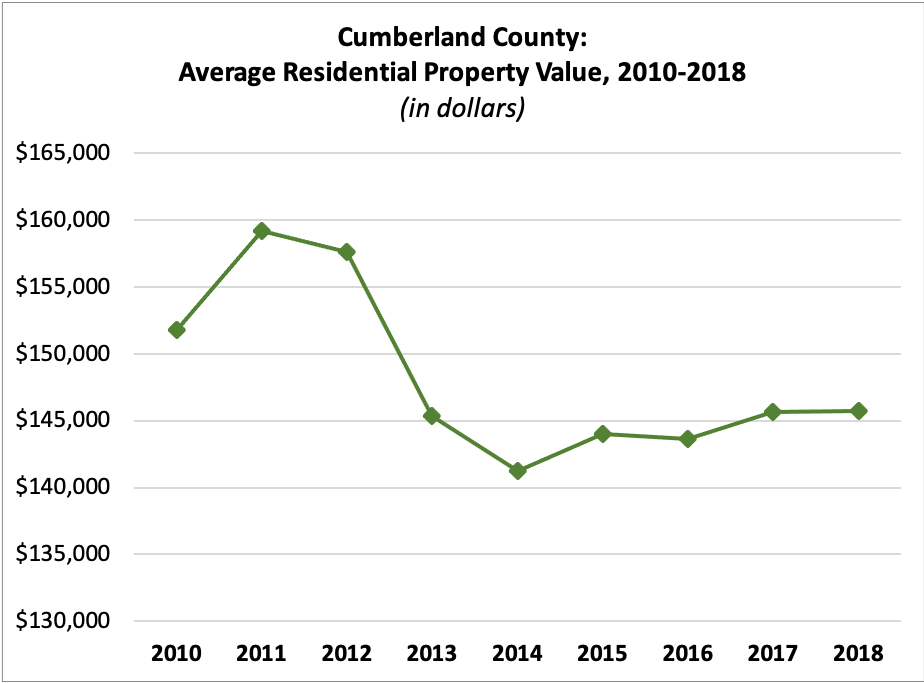
| 2010 | $151,805.48 |
| 2011 | $159,166.07 |
| 2012 | $157,595.50 |
| 2013 | $145,360.34 |
| 2014 | $141,212.83 |
| 2015 | $144,025.77 |
| 2016 | $143,659.42 |
| 2017 | $145,640.54 |
| 2018 | $145,752.23 |
Income per Taxpayer
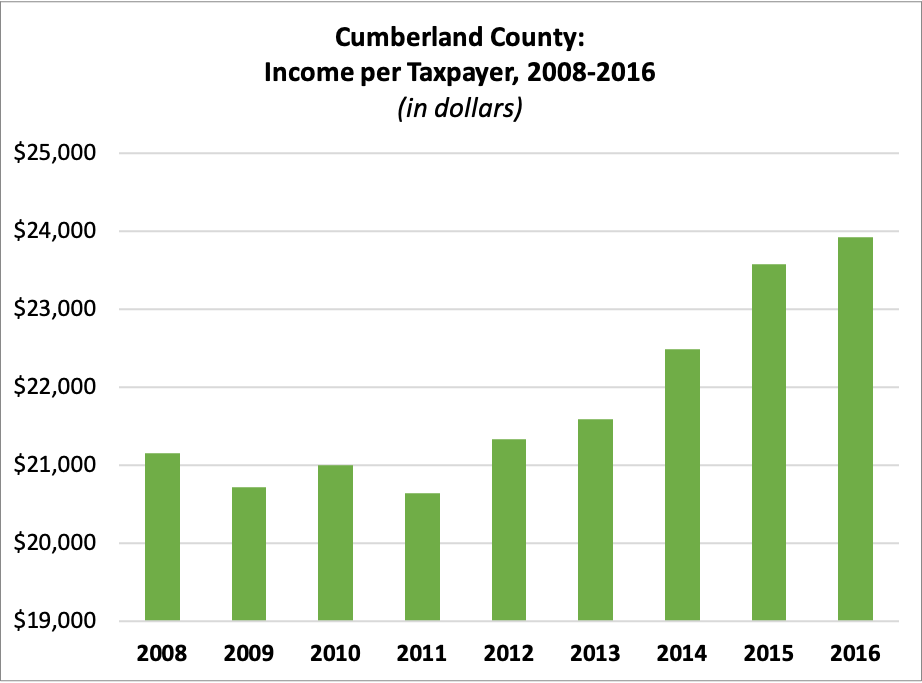
| 2008 | $21,152.33 |
| 2009 | $20,724.79 |
| 2010 | $20,994.50 |
| 2011 | $20,646.82 |
| 2012 | $21,330.95 |
| 2013 | $21,595.09 |
| 2014 | $22,482.73 |
| 2015 | $23,574.07 |
| 2016 | $23,921.88 |
Registered Voters
 Number of Registered Voters
| 2010 | 87,940 |
| 2011 | 89,221 |
| 2012 | 92,653 |
| 2013 | 88,009 |
| 2014 | 88,859 |
| 2015 | 87,303 |
| 2016 | 91,639 |
| 2017 | 89,420 |
| 2018 | 90,538 |
| 2019 | 90,508 |
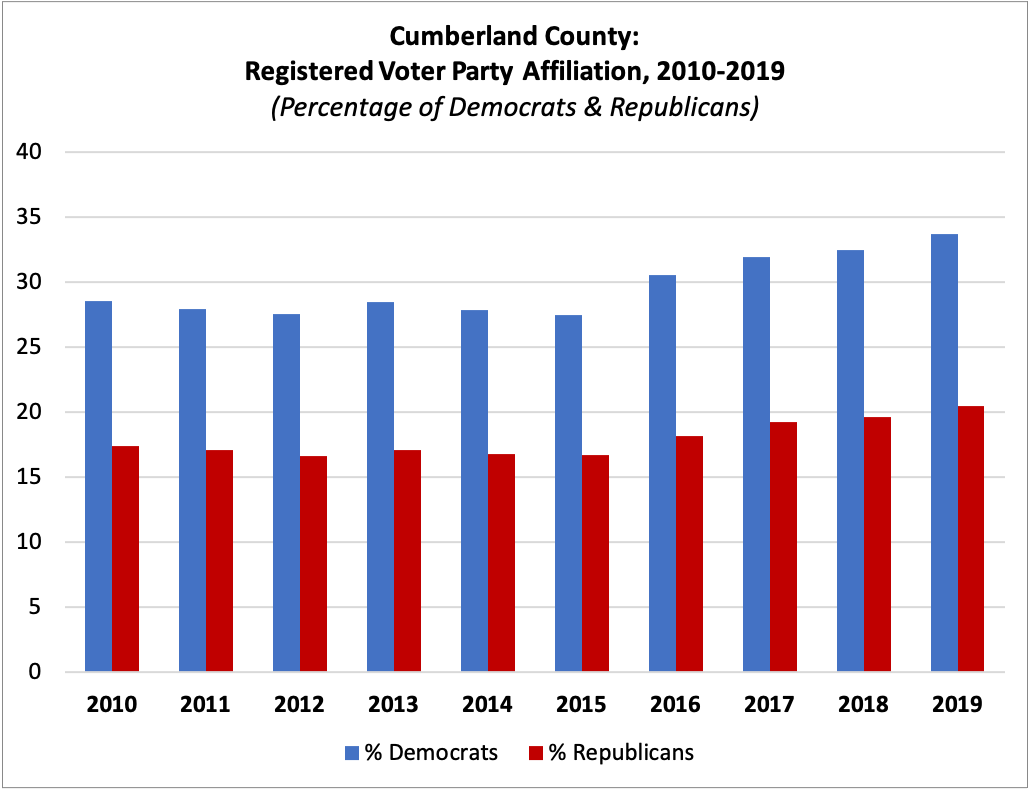
Percent Registered as Democrats
| 2010 | 28.56% |
| 2011 | 27.93% |
| 2012 | 27.52% |
| 2013 | 28.45% |
| 2014 | 27.84% |
| 2015 | 27.45% |
| 2016 | 30.54% |
| 2017 | 31.93% |
| 2018 | 32.48% |
| 2019 | 33.72% |
Percent Registered as Republicans
| 2010 | 17.41% |
| 2011 | 17.06% |
| 2012 | 16.65% |
| 2013 | 17.10% |
| 2014 | 16.78% |
| 2015 | 16.67% |
| 2016 | 18.19% |
| 2017 | 19.27% |
| 2018 | 19.66% |
| 2019 | 20.50% |
For this and more data, visit njdatabook.rutgers.edu!
References
1. About Cumberland County. Cumberland County, NJ Official Website. Retrieved from http://www.co.cumberland.nj.us/About.