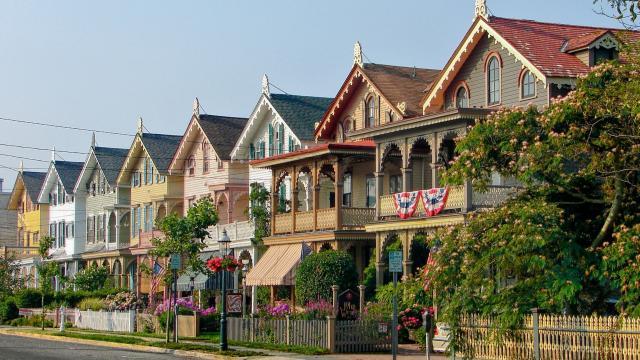
Cape May County ranks 14th in land area compared to the rest of the counties in the state and incorporates 16 municipalities, some of which are popular Jersey shore destinations. The county has a rich maritime history, where Naval Air Station Wildwood and Cape May County Airport, once a dive bomber squadron training facility, once buzzed with activity during World War II. [1]
Cape May County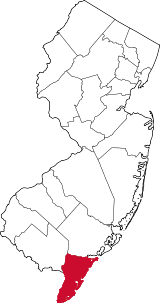
Facts and Figures from the NJ Data Book
Area
251.42 square miles
Density
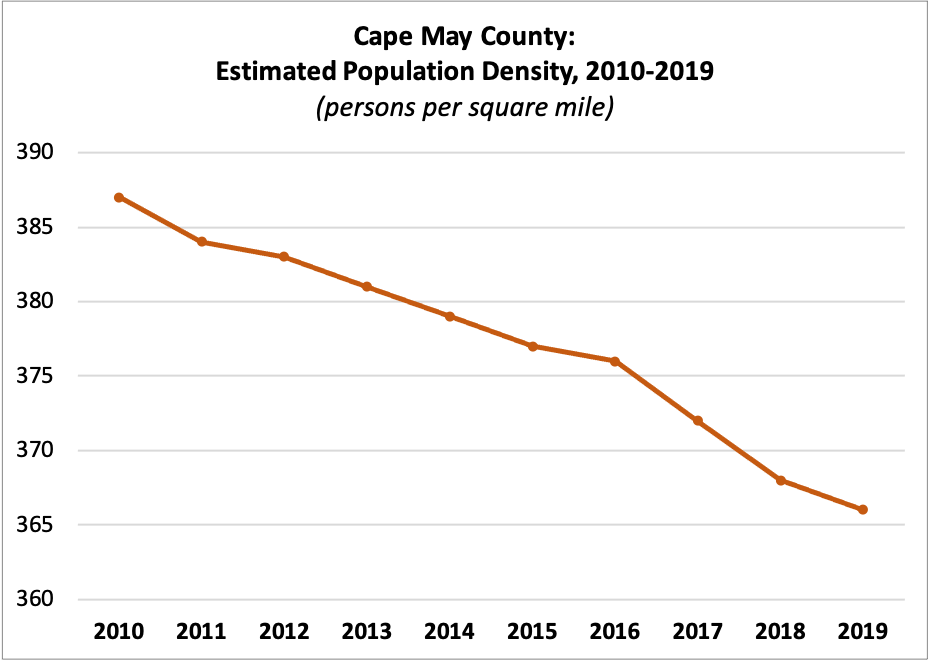
| 2010 | 387 |
| 2011 | 384 |
| 2012 | 383 |
| 2013 | 381 |
| 2014 | 379 |
| 2015 | 377 |
| 2016 | 376 |
| 2017 | 372 |
| 2018 | 368 |
| 2019 | 366 |
Census Population
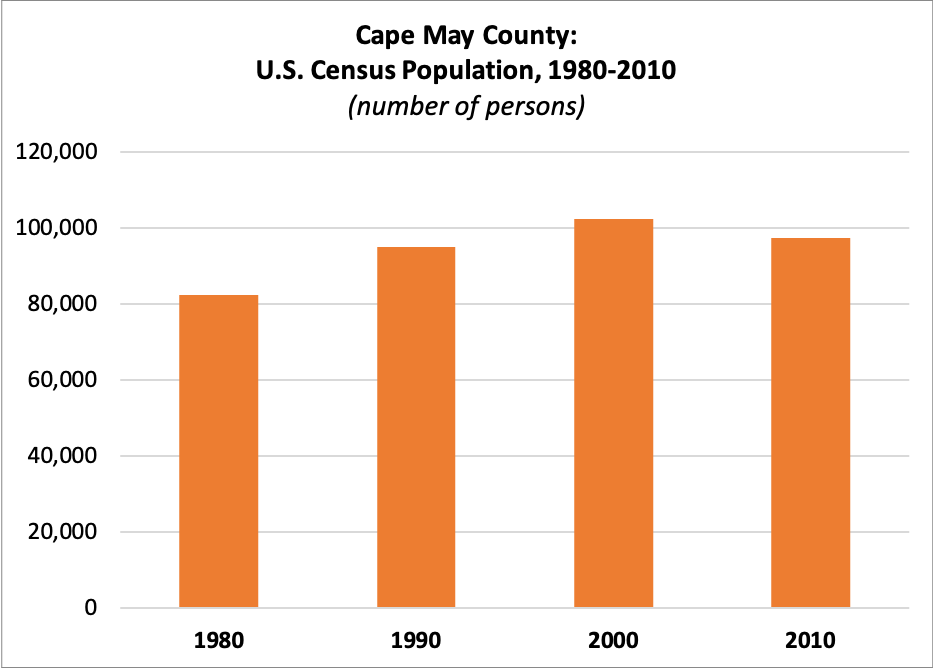
| 1980 | 82,266 |
| 1990 | 95,089 |
| 2000 | 102,326 |
| 2010 | 97,265 |
Estimated Population
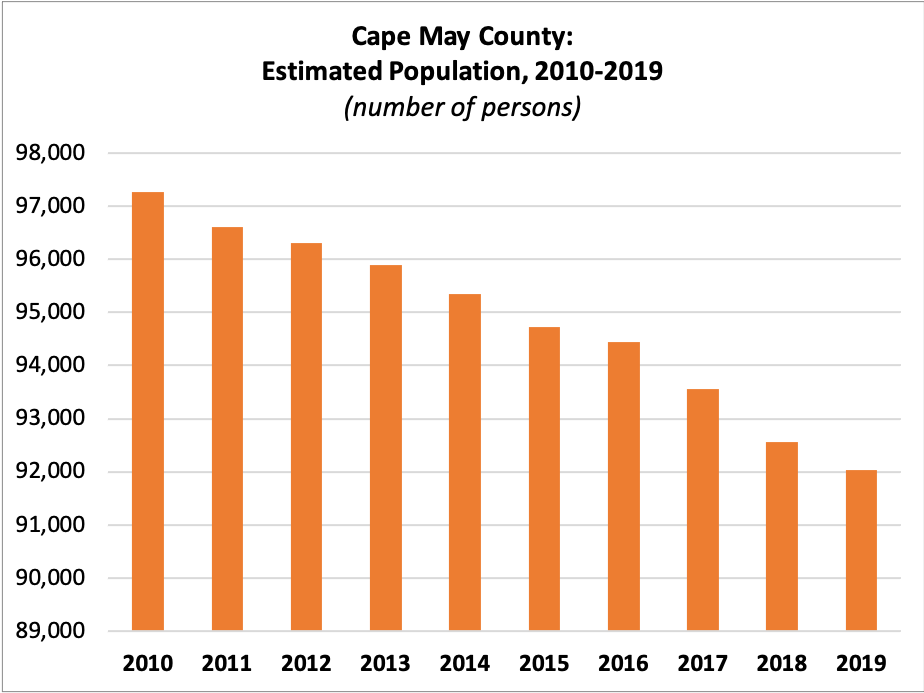
| 2010 | 97,265 |
| 2011 | 96,601 |
| 2012 | 96,304 |
| 2013 | 95,897 |
| 2014 | 95,344 |
| 2015 | 94,727 |
| 2016 | 94,430 |
| 2017 | 93,553 |
| 2018 | 92,560 |
| 2019 | 92,039 |
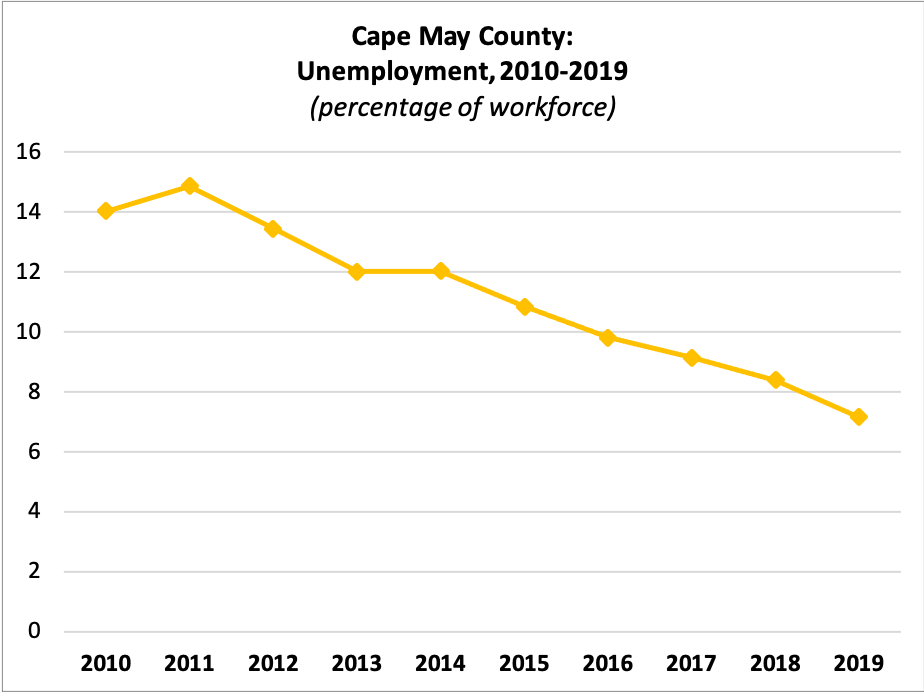
Unemployment
 Workforce:
| 2010 | 50,032 |
| 2011 | 49,421 |
| 2012 | 58,230 |
| 2013 | 57,124 |
| 2014 | 48,954 |
| 2015 | 48,893 |
| 2016 | 47,220 |
| 2017 | 47,090 |
| 2018 | 45,788 |
| 2019 | 45,946 |
Percent Unemployed:
| 2010 | 14.04% |
| 2011 | 14.87% |
| 2012 | 13.45% |
| 2013 | 12.02% |
| 2014 | 12.03% |
| 2015 | 10.85% |
| 2016 | 9.81% |
| 2017 | 9.15% |
| 2018 | 8.39% |
| 2019 | 7.15% |
Median Rent
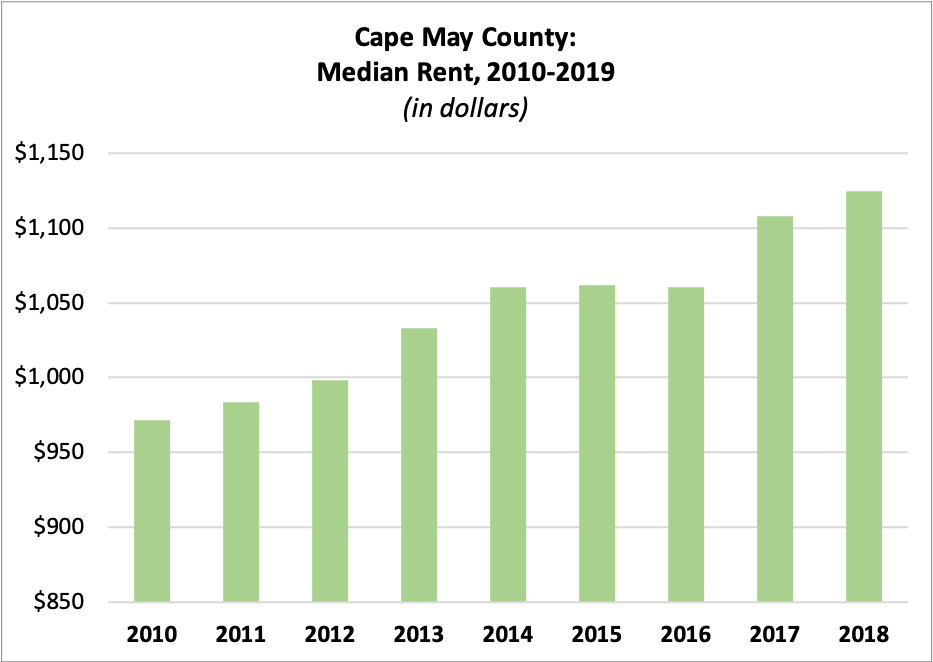
| 2010 | $971.43 |
| 2011 | $983.78 |
| 2012 | $997.90 |
| 2013 | $1,033.27 |
| 2014 | $1,060.25 |
| 2015 | $1,061.60 |
| 2016 | $1,060.25 |
| 2017 | $1,108.00 |
| 2018 | $1,124.58 |
Average Residential Property Value
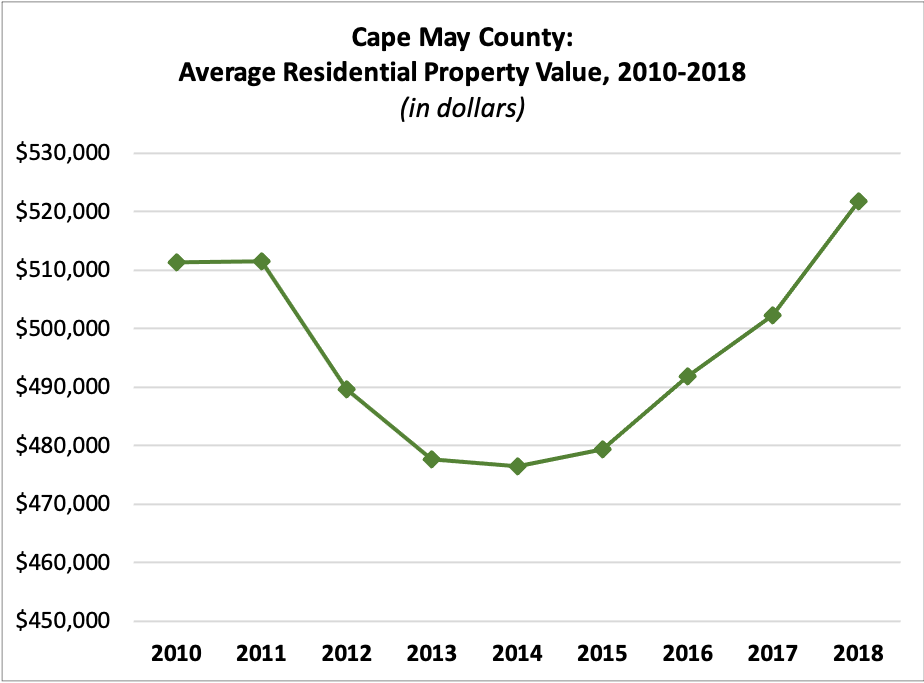
| 2010 | $511,376.37 |
| 2011 | $511,532.07 |
| 2012 | $489,608.27 |
| 2013 | $477,744.48 |
| 2014 | $476,523.43 |
| 2015 | $479,374.10 |
| 2016 | $491,812.60 |
| 2017 | $502,292.23 |
| 2018 | $521,865.32 |
Income per Taxpayer
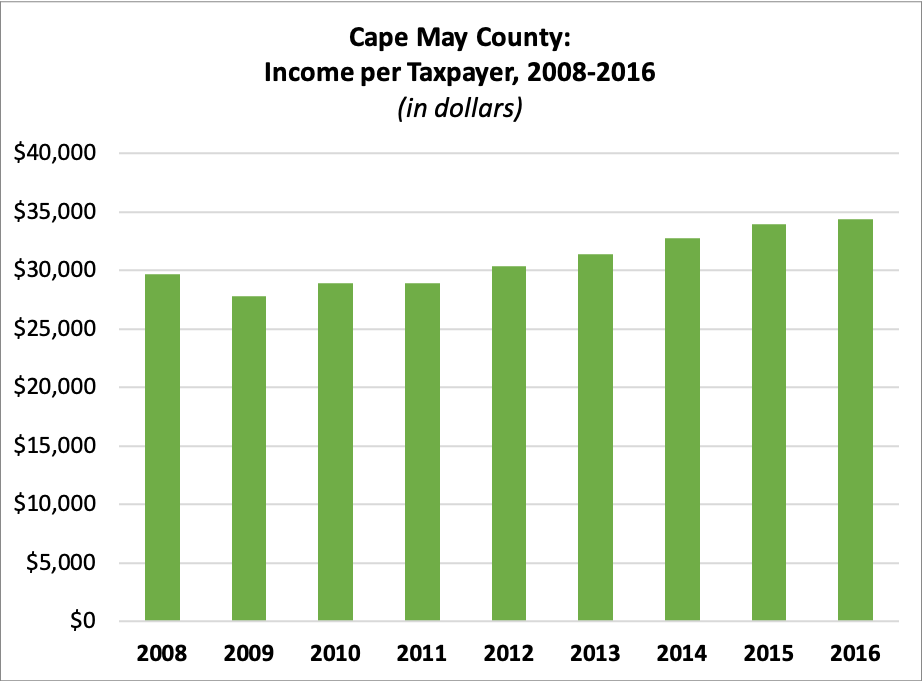
| 2008 | $29,678.05 |
| 2009 | $27,816.08 |
| 2010 | $28,860.96 |
| 2011 | $28,920.39 |
| 2012 | $30,381.56 |
| 2013 | $31,343.42 |
| 2014 | $32,707.26 |
| 2015 | $33,966.63 |
| 2016 | $34,332.64 |
Registered Voters
 Number of Registered Voters
| 2010 | 69,354 |
| 2011 | 68,330 |
| 2012 | 69,041 |
| 2013 | 67,693 |
| 2014 | 67,989 |
| 2015 | 67,218 |
| 2016 | 70,801 |
| 2017 | 70,278 |
| 2018 | 71,802 |
| 2019 | 72,145 |
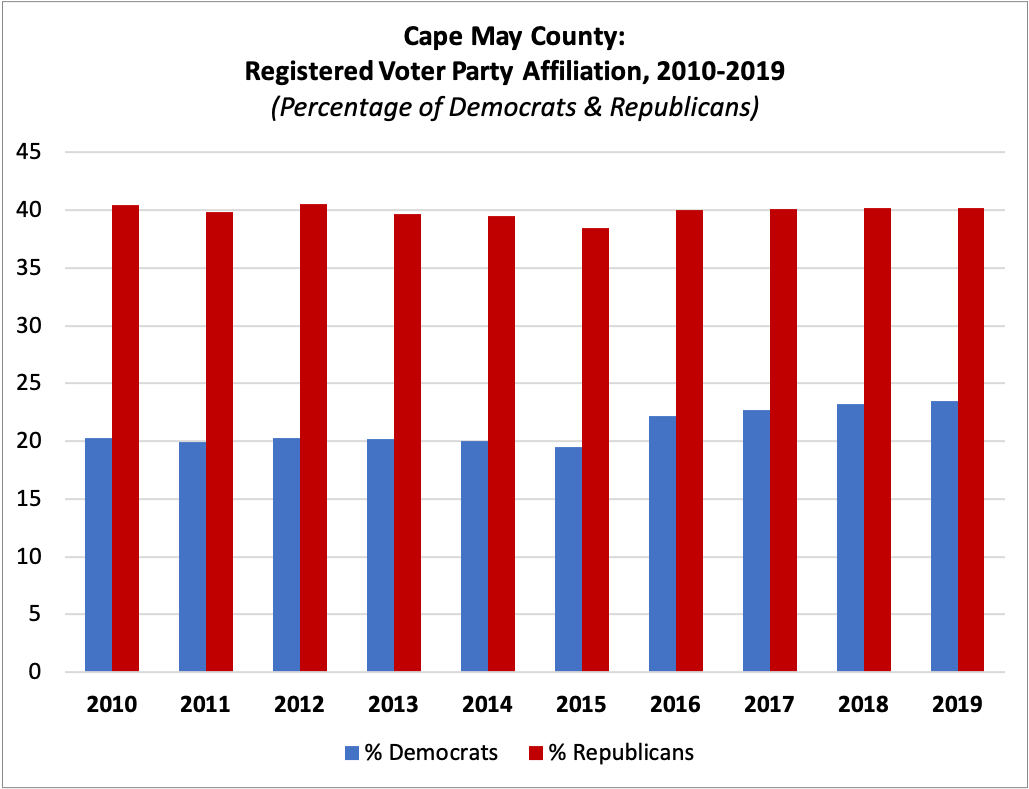
Percent Registered as Democrats
| 2010 | 20.24% |
| 2011 | 19.96% |
| 2012 | 20.28% |
| 2013 | 20.18% |
| 2014 | 20.01% |
| 2015 | 19.51% |
| 2016 | 22.19% |
| 2017 | 22.67% |
| 2018 | 23.21% |
| 2019 | 23.49% |
Percent Registered as Republicans
| 2010 | 40.47% |
| 2011 | 39.85% |
| 2012 | 40.50% |
| 2013 | 39.62% |
| 2014 | 39.47% |
| 2015 | 38.48% |
| 2016 | 39.99% |
| 2017 | 40.09% |
| 2018 | 40.22% |
| 2019 | 40.19% |
For this and more data, visit njdatabook.rutgers.edu!
References
1. History. Cape May County, NJ Official Website. Retrieved from https://capemaycountynj.gov/950/History.