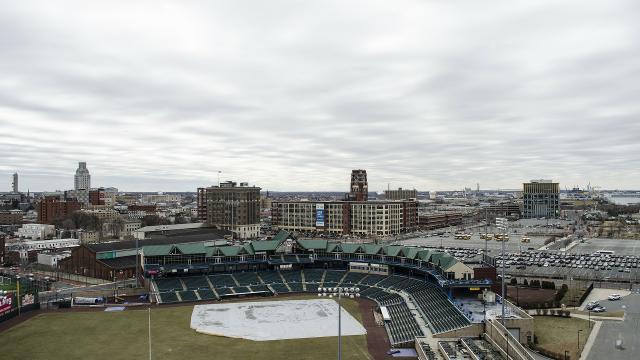
Camden County’s origins can be traced back as far as 1681 and eventually emerged as a commercial and industrial leader in the late nineteenth century. The Campbell Soup Company corporate headquarters still remains there today. [1] There are 37 municipalities that make up Camden County and it is the fifth-smallest county by land area.
Camden County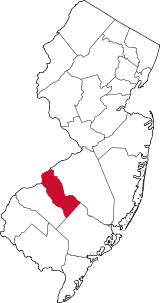
Facts and Figures from the NJ Data Book
Area
221.27 square miles
Density
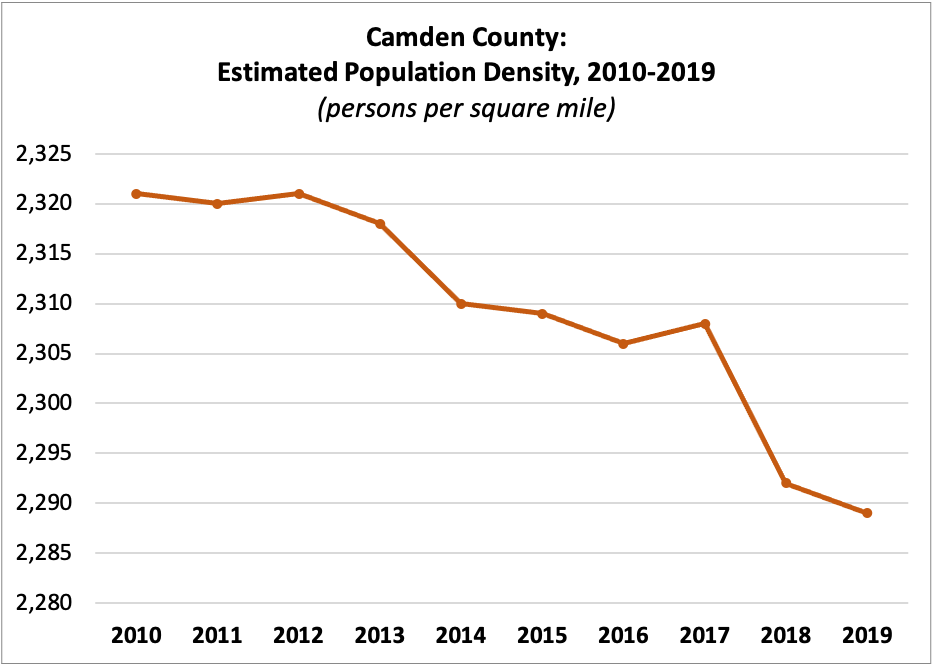
| 2010 | 2,321 |
| 2011 | 2,320 |
| 2012 | 2,321 |
| 2013 | 2,318 |
| 2014 | 2,310 |
| 2015 | 2,309 |
| 2016 | 2,306 |
| 2017 | 2,308 |
| 2018 | 2,292 |
| 2019 | 2,289 |
Census Population
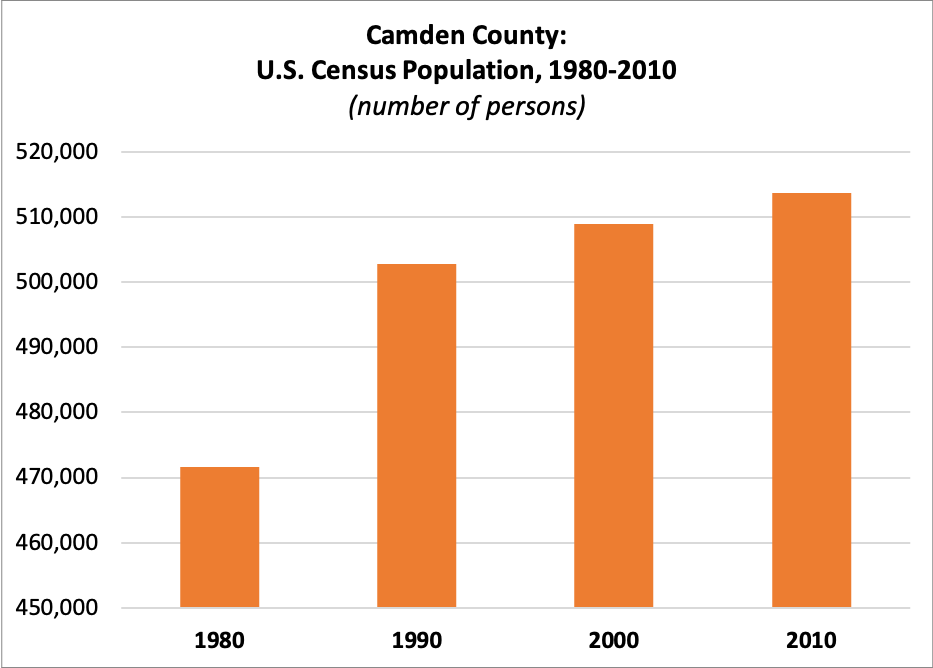
| 1980 | 471,650 |
| 1990 | 502,824 |
| 2000 | 508,932 |
| 2010 | 513,657 |
Estimated Population
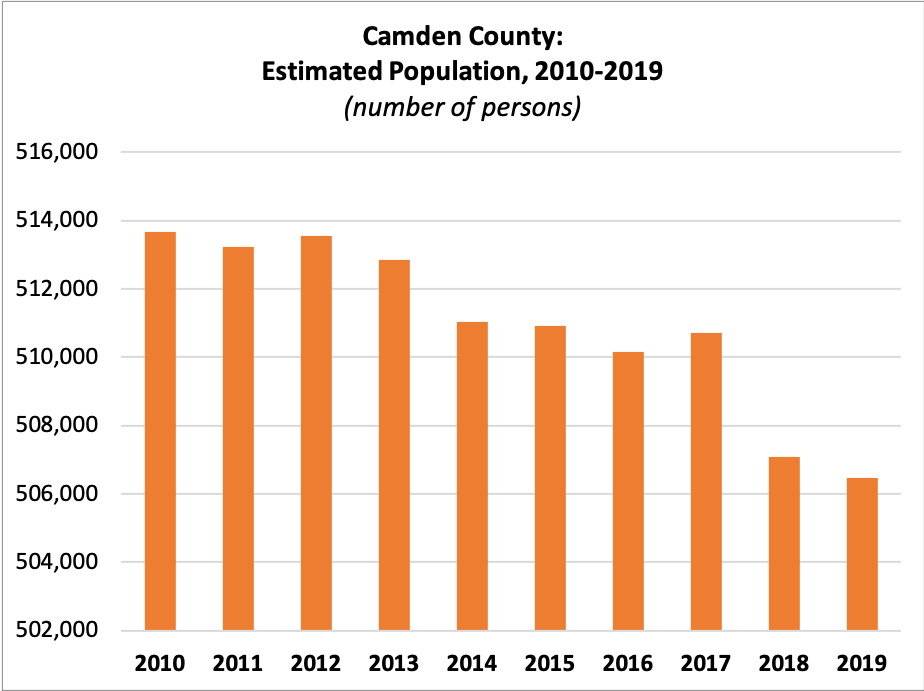
| 2010 | 513,657 |
| 2011 | 513,241 |
| 2012 | 513,539 |
| 2013 | 512,854 |
| 2014 | 511,038 |
| 2015 | 510,923 |
| 2016 | 510,150 |
| 2017 | 510,719 |
| 2018 | 507,078 |
| 2019 | 506,471 |
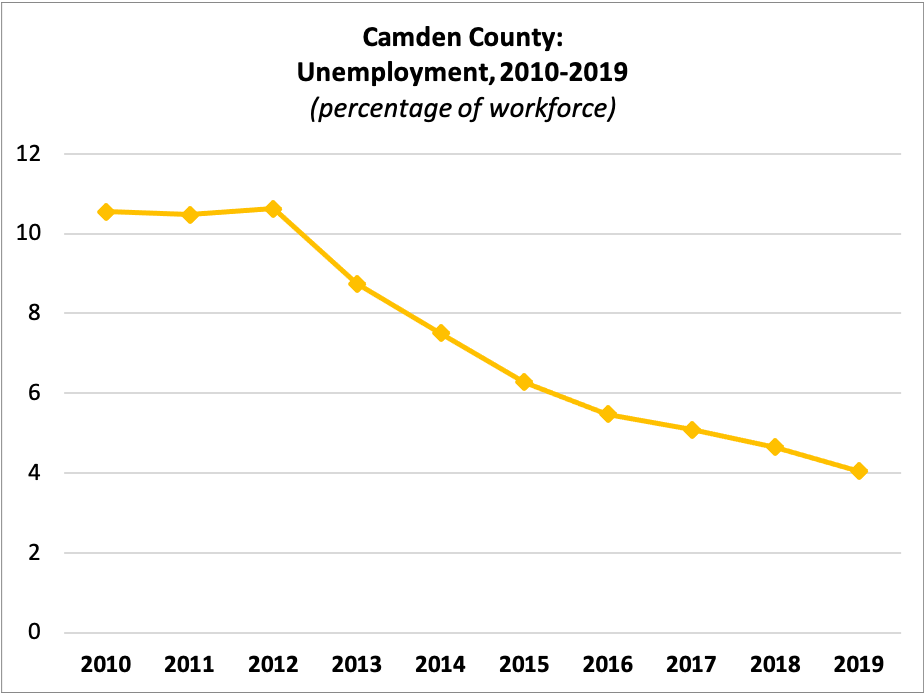
Unemployment
 Workforce:
| 2010 | 264,687 |
| 2011 | 263,157 |
| 2012 | 267,762 |
| 2013 | 259,757 |
| 2014 | 255,546 |
| 2015 | 255,348 |
| 2016 | 255,629 |
| 2017 | 256,930 |
| 2018 | 249,950 |
| 2019 | 253,056 |
Percent Unemployed:
| 2010 | 10.55% |
| 2011 | 10.47% |
| 2012 | 10.62% |
| 2013 | 8.74% |
| 2014 | 7.50% |
| 2015 | 6.28% |
| 2016 | 5.47% |
| 2017 | 5.09% |
| 2018 | 4.64% |
| 2019 | 4.05% |
Median Rent
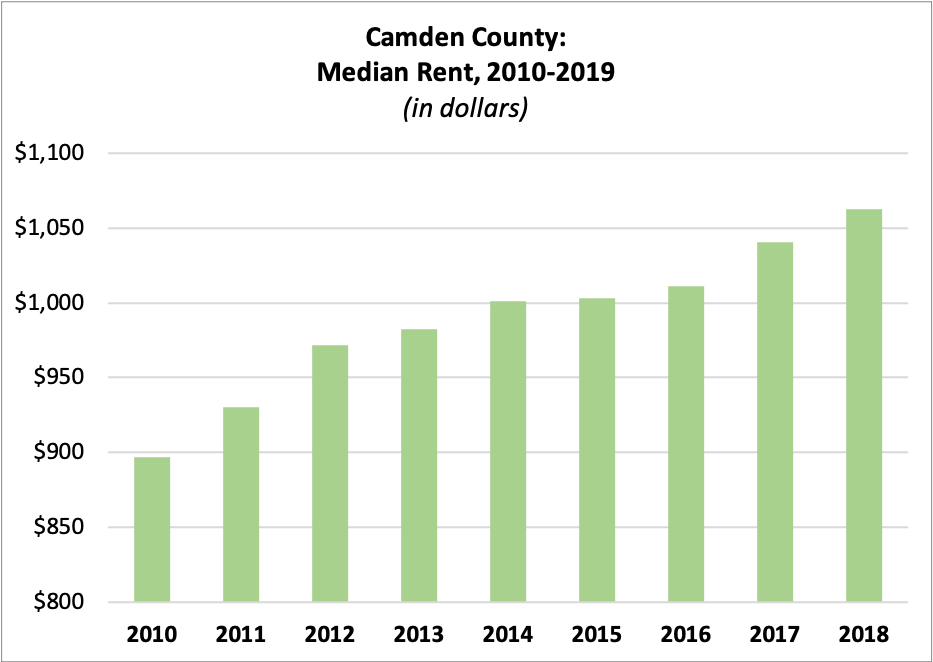
| 2010 | $896.64 |
| 2011 | $930.49 |
| 2012 | $971.47 |
| 2013 | $982.35 |
| 2014 | $1,001.28 |
| 2015 | $1,003.32 |
| 2016 | $1,011.23 |
| 2017 | $1,040.59 |
| 2018 | $1,062.75 |
Average Residential Property Value
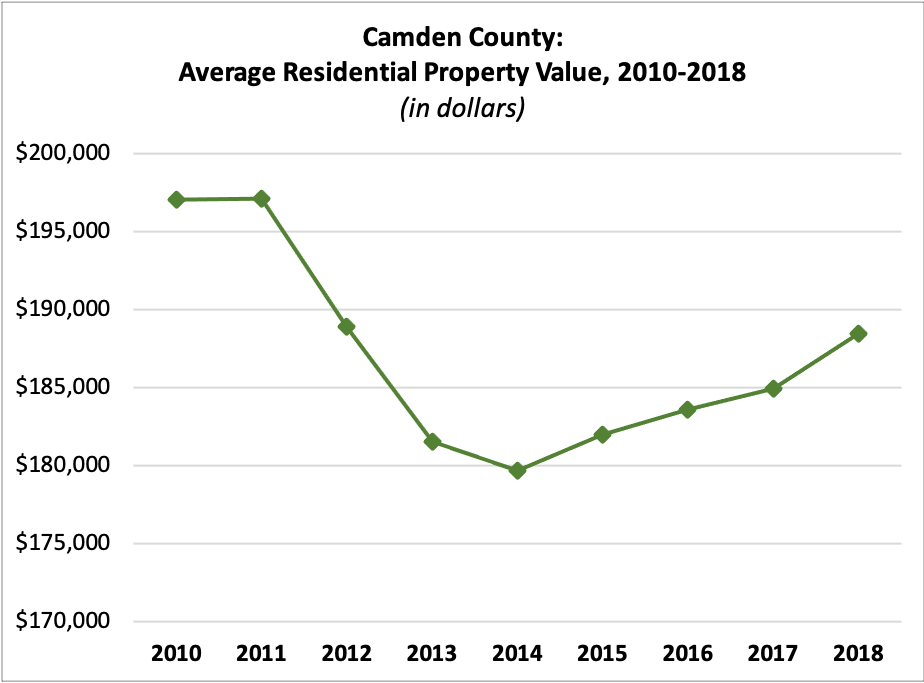
| 2010 | $197,000.40 |
| 2011 | $197,114.78 |
| 2012 | $188,891.02 |
| 2013 | $181,512.38 |
| 2014 | $179,669.25 |
| 2015 | $181,966.85 |
| 2016 | $183,543.13 |
| 2017 | $184,919.99 |
| 2018 | $188,418.44 |
Income per Taxpayer
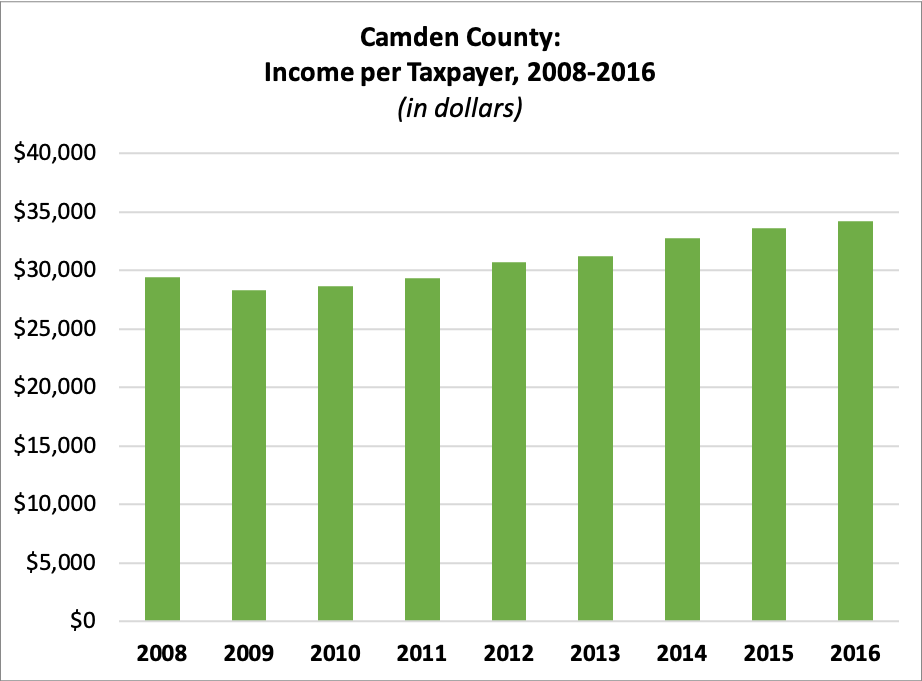
| 2008 | $29,376.07 |
| 2009 | $28,293.46 |
| 2010 | $28,646.34 |
| 2011 | $29,284.71 |
| 2012 | $30,721.21 |
| 2013 | $31,203.16 |
| 2014 | $32,703.37 |
| 2015 | $33,601.19 |
| 2016 | $34,233.83 |
Registered Voters
 Number of Registered Voters
| 2010 | 338,720 |
| 2011 | 343,445 |
| 2012 | 359,722 |
| 2013 | 362,130 |
| 2014 | 364,526 |
| 2015 | 319,870 |
| 2016 | 347,760 |
| 2017 | 348,779 |
| 2018 | 356,954 |
| 2019 | 370,190 |
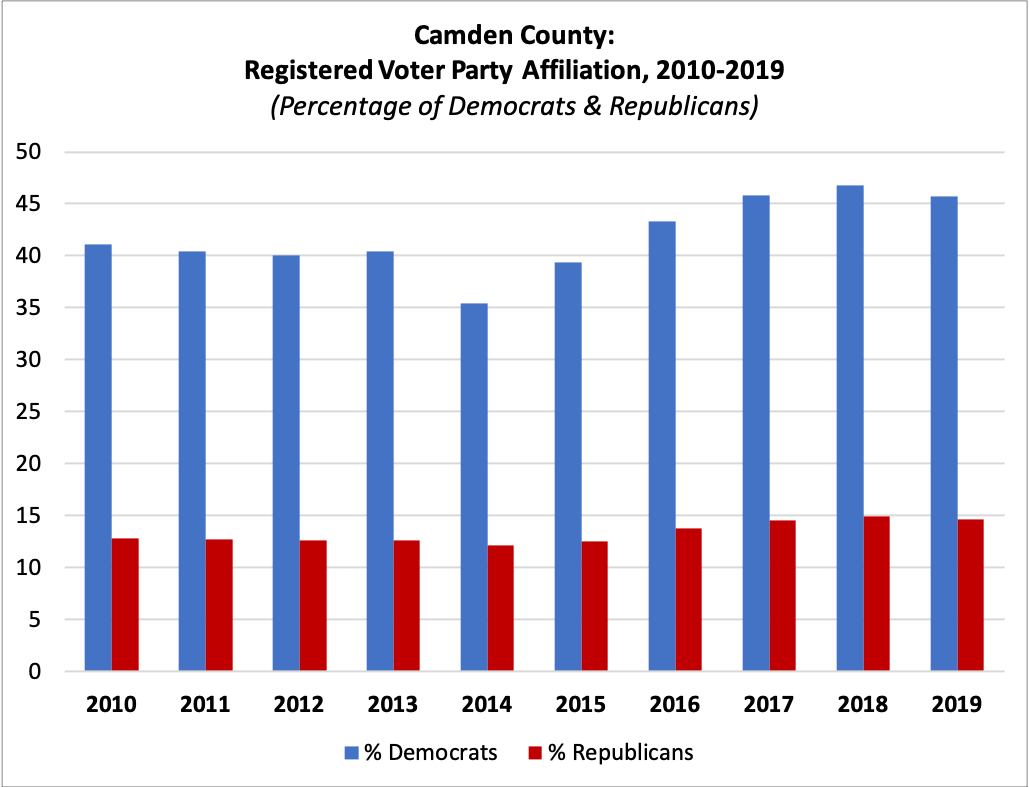
Percent Registered as Democrats
| 2010 | 41.12% |
| 2011 | 40.41% |
| 2012 | 40.06% |
| 2013 | 40.44% |
| 2014 | 35.40% |
| 2015 | 39.37% |
| 2016 | 43.35% |
| 2017 | 45.78% |
| 2018 | 46.80% |
| 2019 | 45.69% |
Percent Registered as Republicans
| 2010 | 12.83% |
| 2011 | 12.74% |
| 2012 | 12.61% |
| 2013 | 12.67% |
| 2014 | 12.16% |
| 2015 | 12.54% |
| 2016 | 13.80% |
| 2017 | 14.58% |
| 2018 | 14.92% |
| 2019 | 14.65% |
For this and more data, visit njdatabook.rutgers.edu!
References
1. History. Camden County, NJ Official Website. Retrieved from https://www.camdencounty.com/enjoy-camden-county/history.