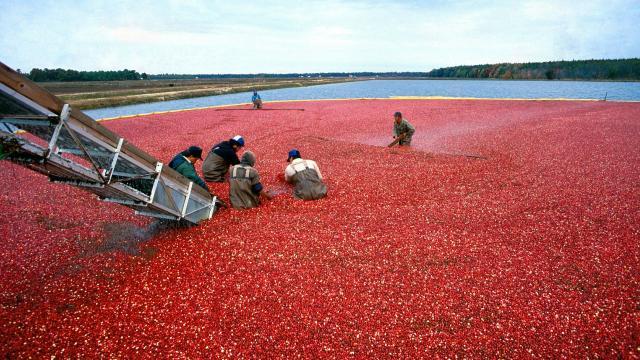
Burlington County is the largest county in the state according to land area. It consists of 40 municipalities and is home to the Pinelands National Reserve, a first in the nation. Burlington County also has deep roots in agriculture, and Whitesbog Village is said to be home of the blueberry. [1]
Burlington County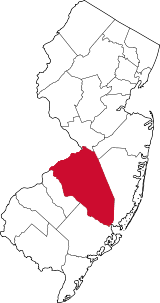
Facts and Figures from the NJ Data Book
Area
798.54 square miles
Density
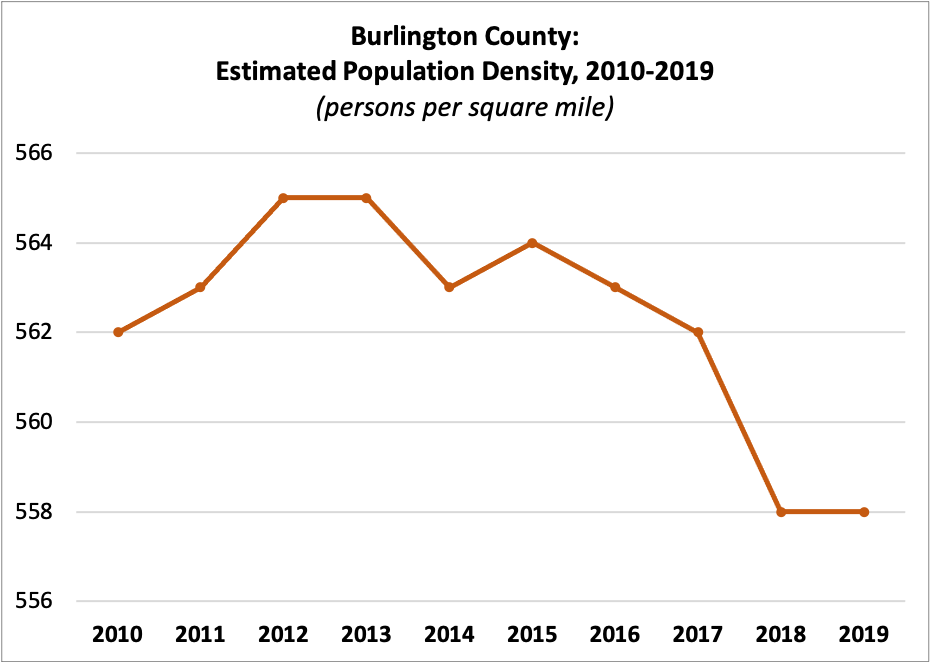
| 2010 | 562 |
| 2011 | 563 |
| 2012 | 565 |
| 2013 | 565 |
| 2014 | 563 |
| 2015 | 564 |
| 2016 | 563 |
| 2017 | 562 |
| 2018 | 558 |
| 2019 | 558 |
Census Population
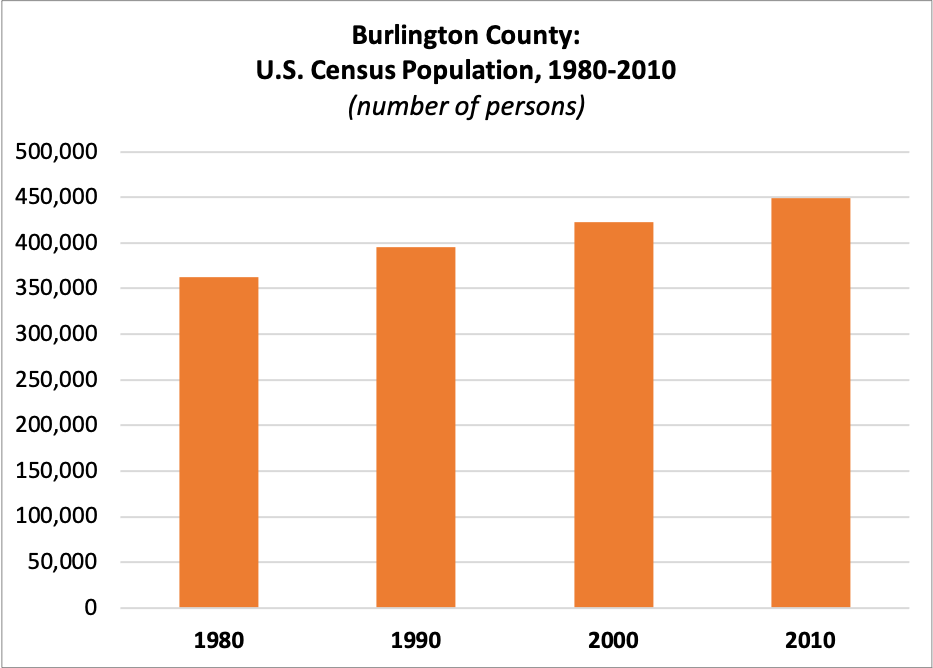
| 1980 | 362,542 |
| 1990 | 395,066 |
| 2000 | 423,394 |
| 2010 | 448,734 |
Estimated Population
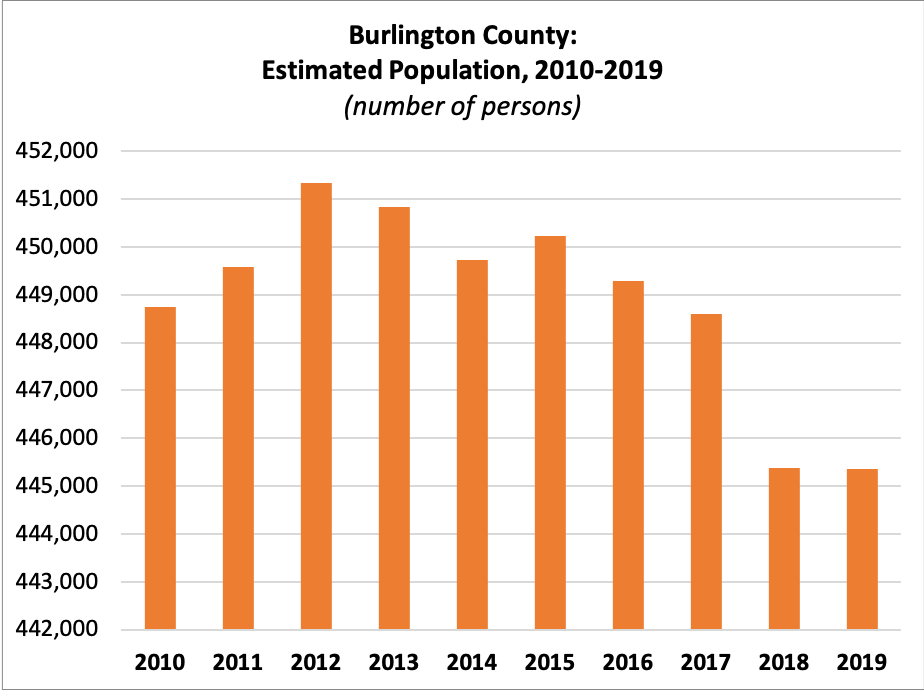
| 2010 | 448,734 |
| 2011 | 449,576 |
| 2012 | 451,336 |
| 2013 | 450,838 |
| 2014 | 449,722 |
| 2015 | 450,226 |
| 2016 | 449,284 |
| 2017 | 448,596 |
| 2018 | 445,384 |
| 2019 | 445,349 |
Unemployment
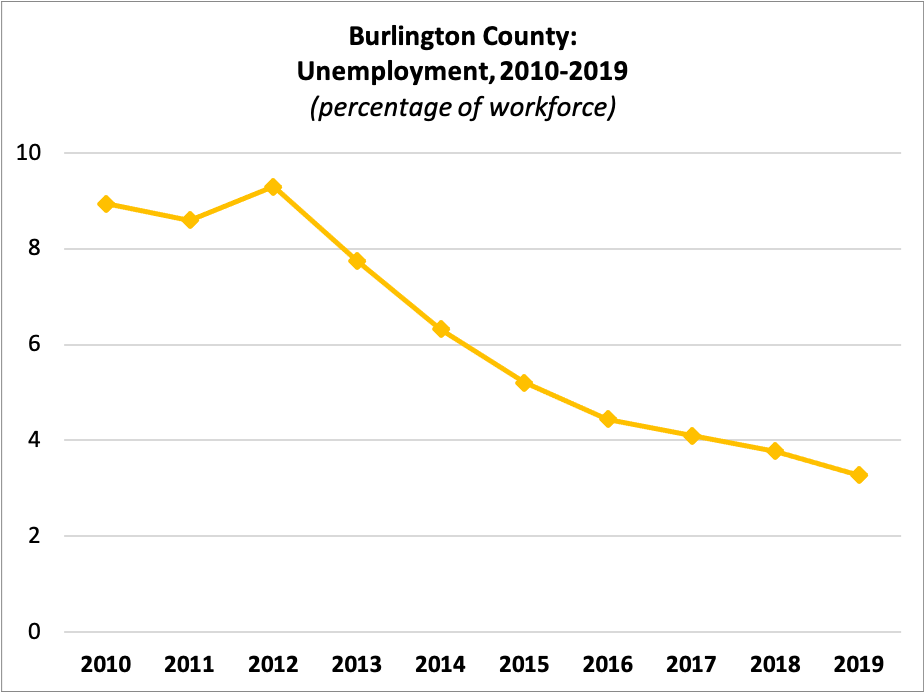 Workforce:
| 2010 | 235,331 |
| 2011 | 233,435 |
| 2012 | 242,973 |
| 2013 | 239,945 |
| 2014 | 232,025 |
| 2015 | 232,363 |
| 2016 | 233,049 |
| 2017 | 234,179 |
| 2018 | 227,447 |
| 2019 | 230,591 |
Percent Unemployed:
| 2010 | 8.94% |
| 2011 | 8.59% |
| 2012 | 9.29% |
| 2013 | 7.75% |
| 2014 | 6.32% |
| 2015 | 5.20% |
| 2016 | 4.44% |
| 2017 | 4.10% |
| 2018 | 3.77% |
| 2019 | 3.27% |
Median Rent
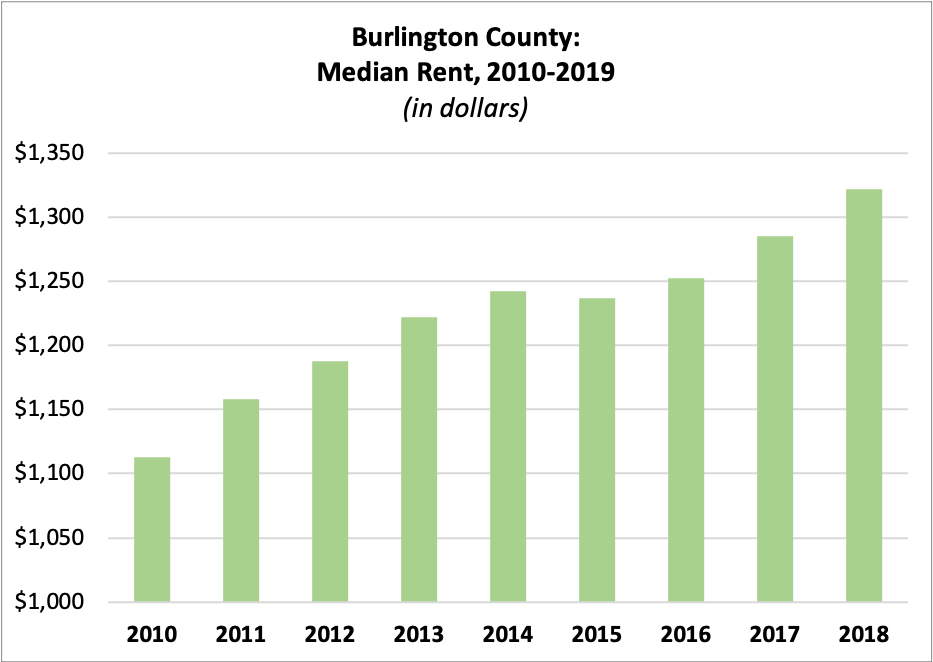
| 2010 | $1,112.79 |
| 2011 | $1,158.46 |
| 2012 | $1,188.12 |
| 2013 | $1,221.82 |
| 2014 | $1,242.11 |
| 2015 | $1,236.55 |
| 2016 | $1,252.40 |
| 2017 | $1,285.49 |
| 2018 | $1,321.79 |
Average Residential Property Value
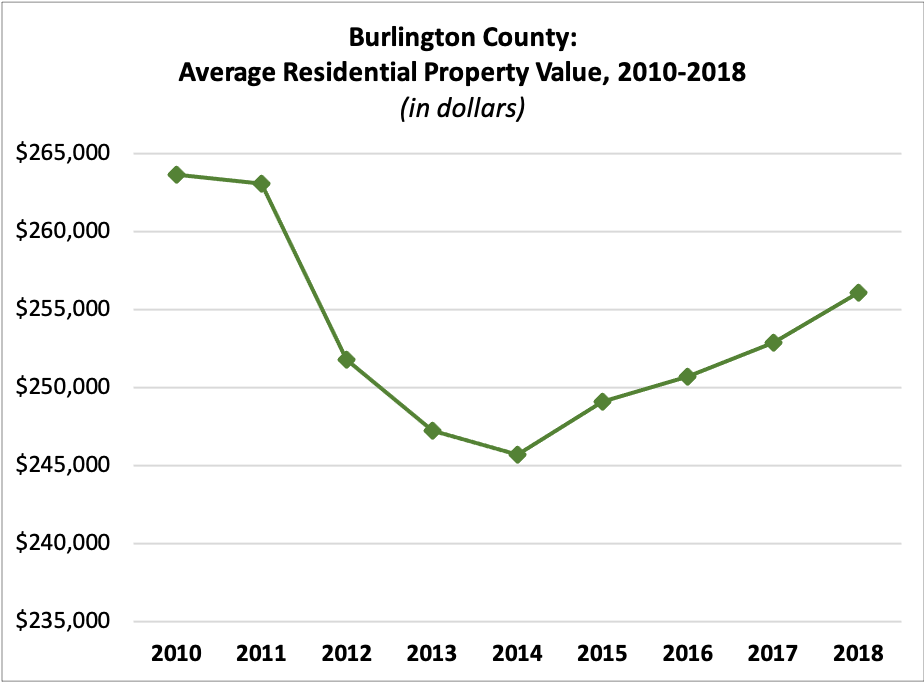
| 2010 | $263,638.13 |
| 2011 | $263,043.14 |
| 2012 | $251,789.61 |
| 2013 | $247,204.25 |
| 2014 | $245,664.03 |
| 2015 | $249,060.87 |
| 2016 | $250,699.20 |
| 2017 | $252,878.10 |
| 2018 | $256,059.69 |
Income per Taxpayer
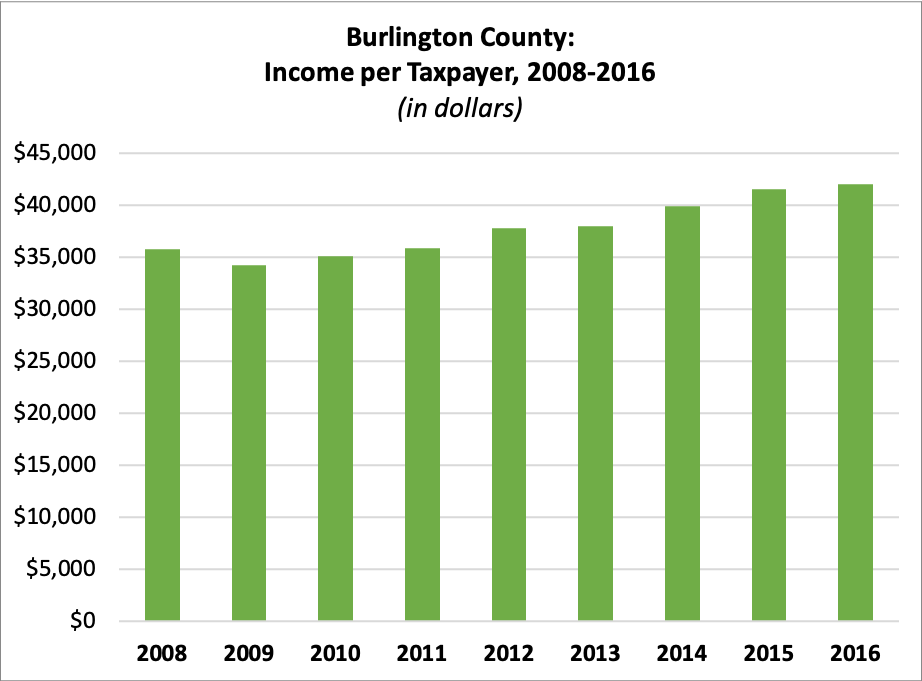
| 2008 | $35,760.46 |
| 2009 | $34,269.76 |
| 2010 | $35,099.42 |
| 2011 | $35,908.69 |
| 2012 | $37,806.22 |
| 2013 | $37,996.71 |
| 2014 | $39,865.62 |
| 2015 | $41,586.15 |
| 2016 | $42,069.85 |
Registered Voters
 Number of Registered Voters
| 2010 | 288,310 |
| 2011 | 283,669 |
| 2012 | 291,760 |
| 2013 | 289,900 |
| 2014 | 292,469 |
| 2015 | 296,493 |
| 2016 | 314,051 |
| 2017 | 310,389 |
| 2018 | 318,872 |
| 2019 | 322,752 |
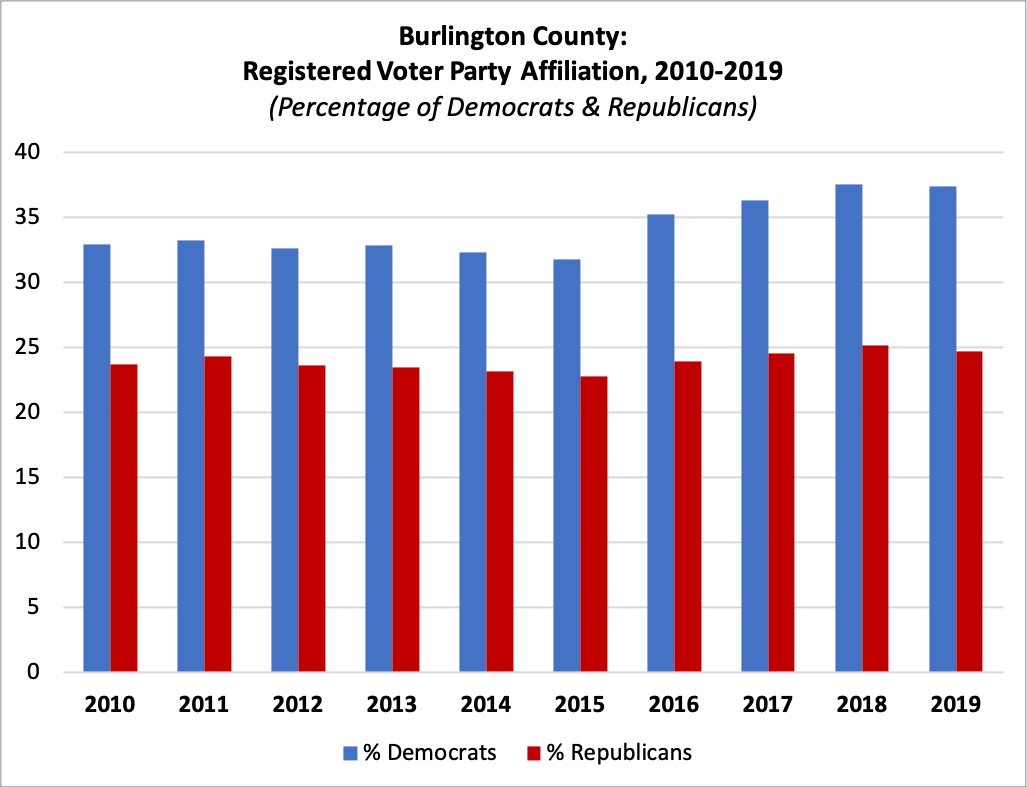
Percent Registered as Democrats
| 2010 | 32.95% |
| 2011 | 33.21% |
| 2012 | 32.64% |
| 2013 | 32.81% |
| 2014 | 32.33% |
| 2015 | 31.75% |
| 2016 | 35.26% |
| 2017 | 36.29% |
| 2018 | 37.57% |
| 2019 | 37.36% |
Percent Registered as Republicans
| 2010 | 23.70% |
| 2011 | 24.33% |
| 2012 | 23.62% |
| 2013 | 23.47% |
| 2014 | 23.17% |
| 2015 | 22.75% |
| 2016 | 23.91% |
| 2017 | 24.56% |
| 2018 | 25.17% |
| 2019 | 24.72% |
For this and more data, visit njdatabook.rutgers.edu!
References
1. History. Burlington County, NJ Official Website. Retrieved from http://co.burlington.nj.us/695/History.