
Featured in this post is Bergen County, New Jersey. Bergen County was found in 1683 and is one of the four original New Jersey counties, along with Essex, Middlesex and Monmouth. It is made up of 70 municipalities and ranks 15th in land area compared to the rest of the counties. [1]
Bergen County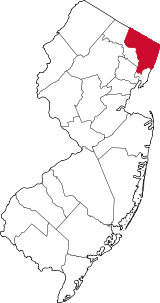
Facts and Figures from the NJ Data Book
Area
555.72 square miles
Density
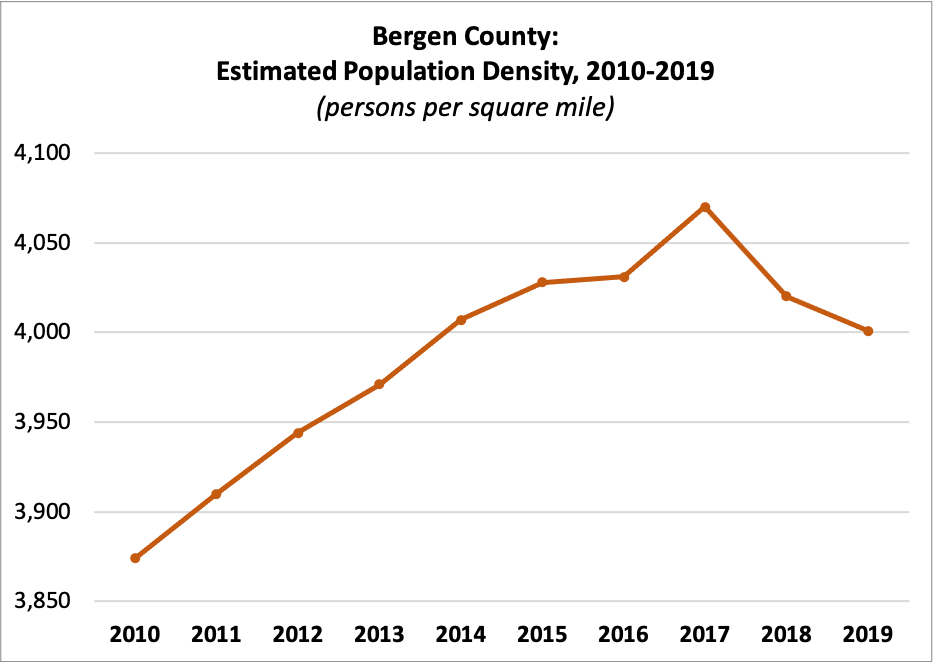
| 2010 | 3,874 |
| 2011 | 3,910 |
| 2012 | 3,944 |
| 2013 | 3,971 |
| 2014 | 4,007 |
| 2015 | 4,028 |
| 2016 | 4,031 |
| 2017 | 4,070 |
| 2018 | 4,020 |
| 2019 | 4,001 |
Census Population
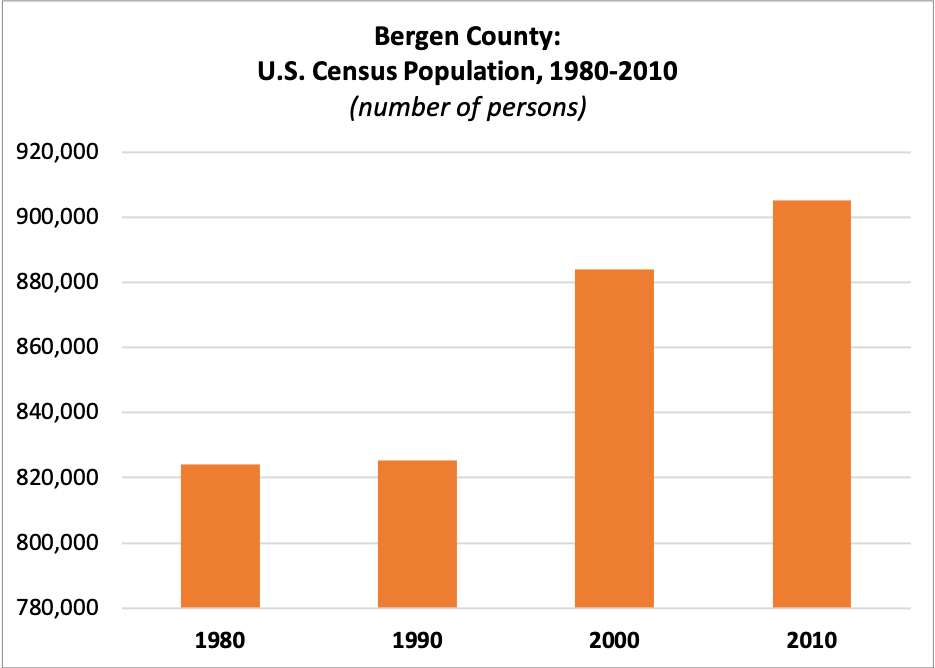
| 1980 | 824,055 |
| 1990 | 825,380 |
| 2000 | 884,118 |
| 2010 | 905,116 |
Estimated Population
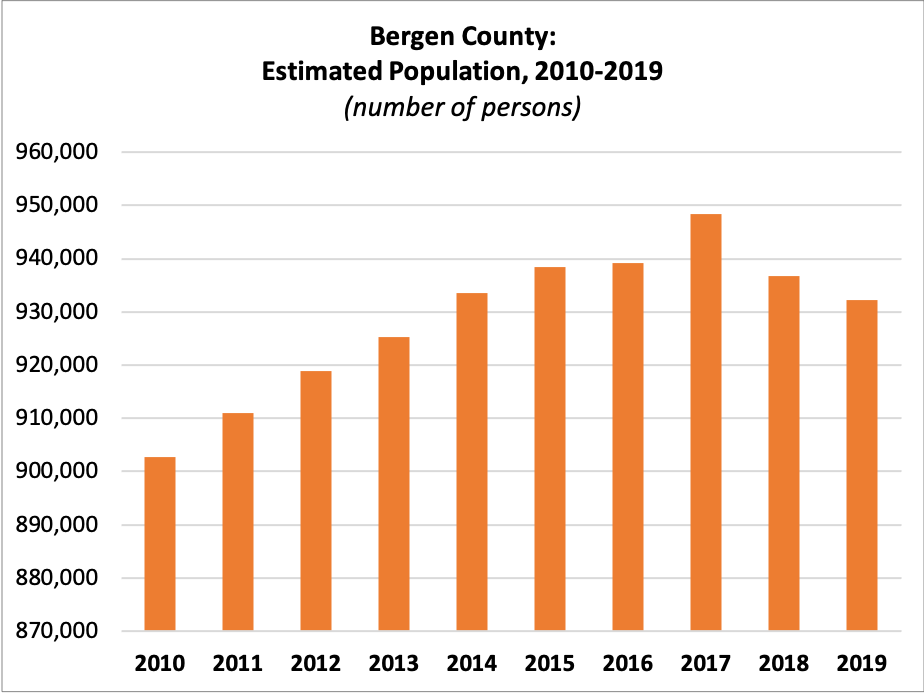
| 2010 | 902,665 |
| 2011 | 911,004 |
| 2012 | 918,888 |
| 2013 | 925,328 |
| 2014 | 933,572 |
| 2015 | 938,506 |
| 2016 | 939,151 |
| 2017 | 948,406 |
| 2018 | 936,692 |
| 2019 | 932,202 |
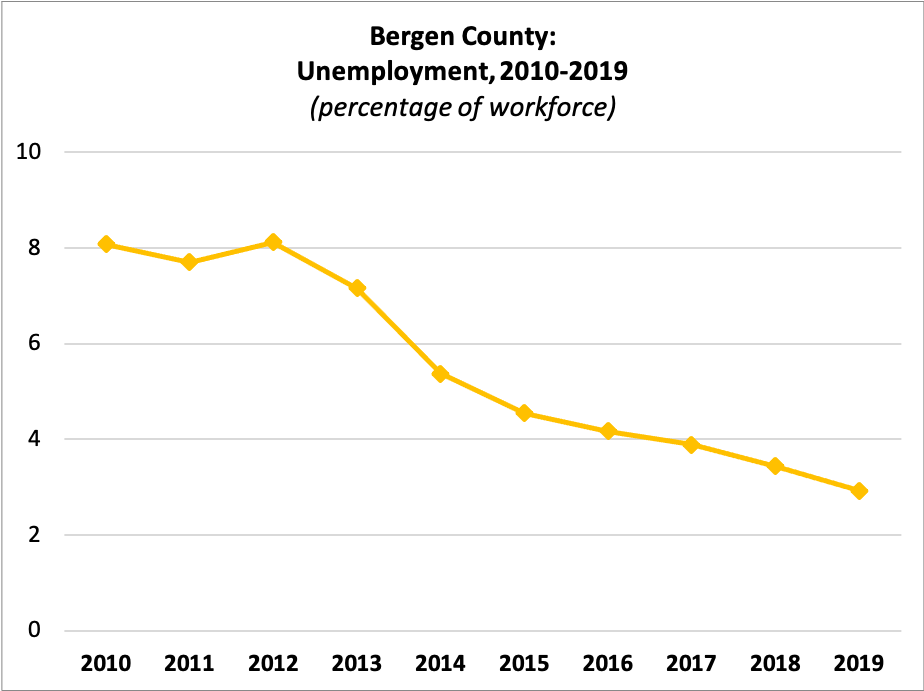
Unemployment
 Workforce:
| 2010 | 477,564 |
| 2011 | 479,356 |
| 2012 | 483,211 |
| 2013 | 474,432 |
| 2014 | 479,446 |
| 2015 | 485,324 |
| 2016 | 484,174 |
| 2017 | 483,326 |
| 2018 | 472,002 |
| 2019 | 482,044 |
Percent Unemployed:
| 2010 | 8.08% |
| 2011 | 7.70% |
| 2012 | 8.12% |
| 2013 | 7.16% |
| 2014 | 5.37% |
| 2015 | 4.55% |
| 2016 | 4.17% |
| 2017 | 3.89% |
| 2018 | 3.44% |
| 2019 | 2.92% |
Median Rent
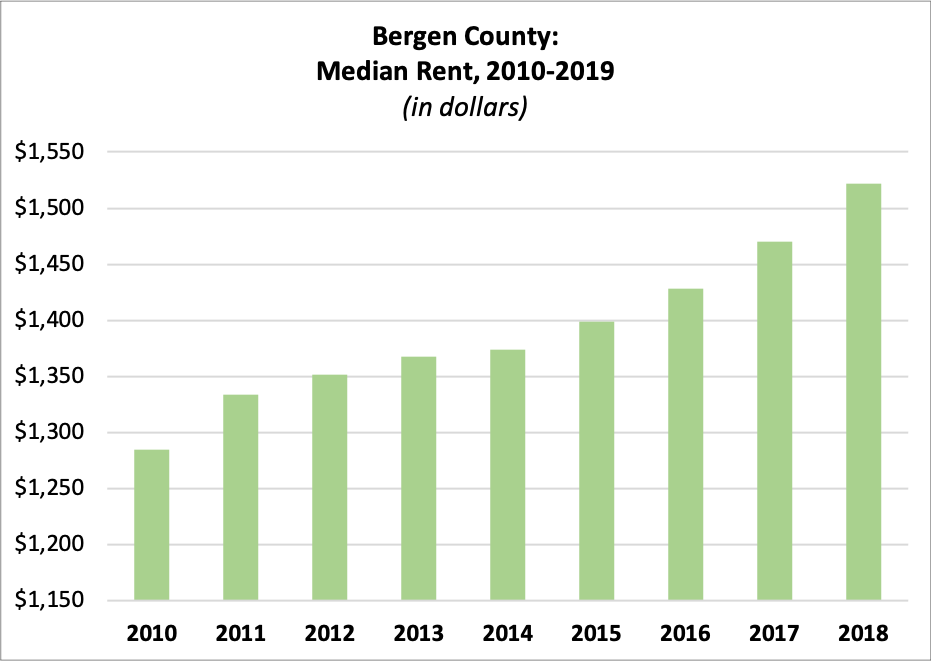
| 2010 | $1,284.79 |
| 2011 | $1,333.51 |
| 2012 | $1,351.29 |
| 2013 | $1,367.42 |
| 2014 | $1,373.63 |
| 2015 | $1,399.26 |
| 2016 | $1,428.49 |
| 2017 | $1,469.86 |
| 2018 | $1,522.01 |
Average Residential Property Value
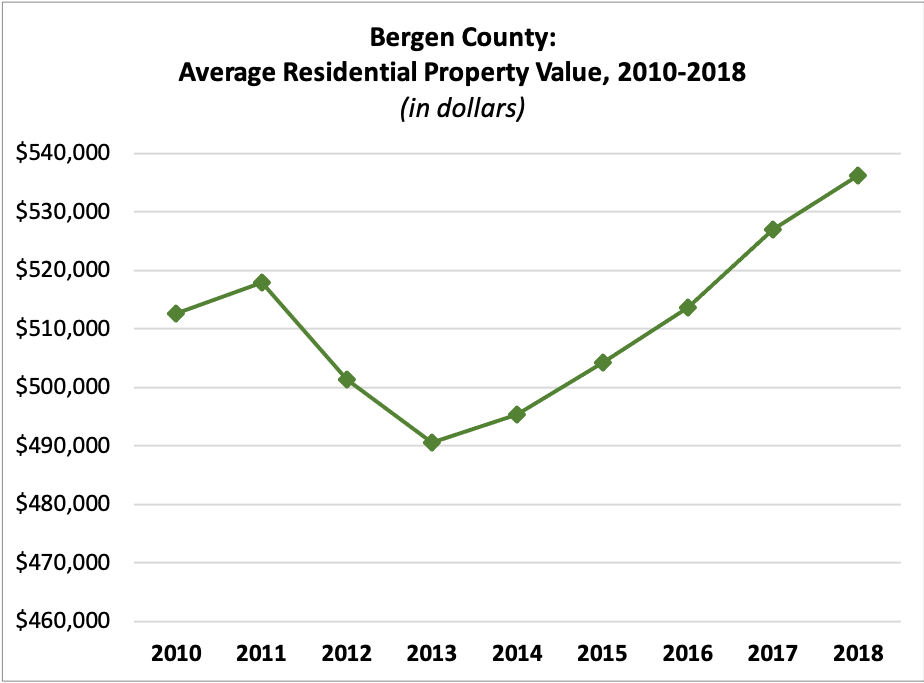
| 2010 | $512,613.86 |
| 2011 | $517,834.03 |
| 2012 | $501,308.50 |
| 2013 | $490,520.83 |
| 2014 | $495,378.10 |
| 2015 | $504,239.37 |
| 2016 | $513,629.69 |
| 2017 | $526,915.80 |
| 2018 | $536,270.65 |
Income per Taxpayer
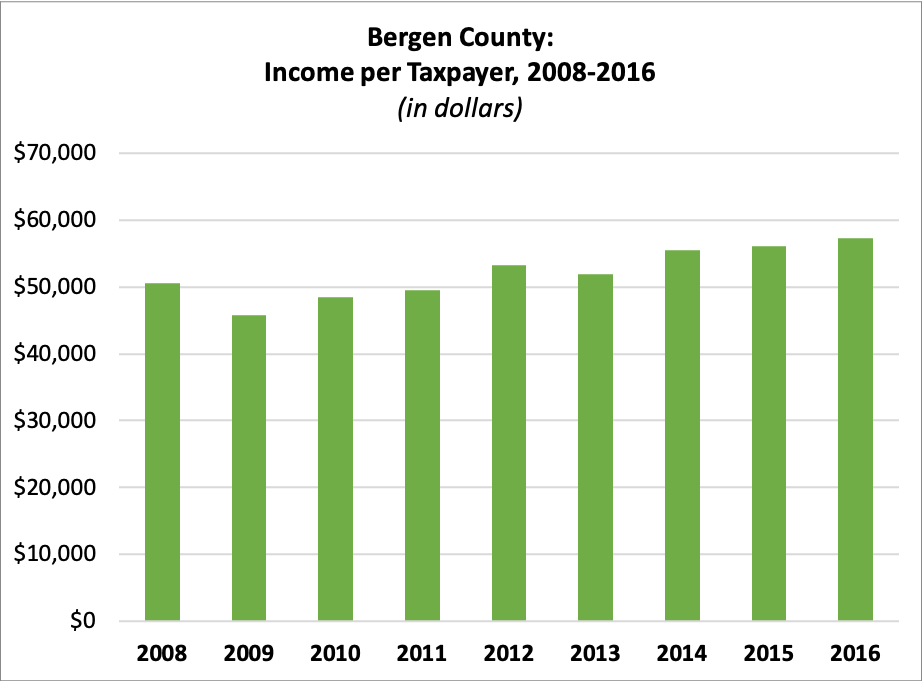
| 2008 | $50,503.77 |
| 2009 | $45,734.82 |
| 2010 | $48,469.16 |
| 2011 | $49,457.96 |
| 2012 | $53,258.54 |
| 2013 | $51,844.80 |
| 2014 | $55,456.94 |
| 2015 | $56,124.67 |
| 2016 | $57,243.04 |
Registered Voters
 Number of Registered Voters
| 2010 | 495,479 |
| 2011 | 494,949 |
| 2012 | 551,745 |
| 2013 | 527,491 |
| 2014 | 519,007 |
| 2015 | 542,466 |
| 2016 | 588,362 |
| 2017 | 559,538 |
| 2018 | 567,568 |
| 2019 | 627,815 |
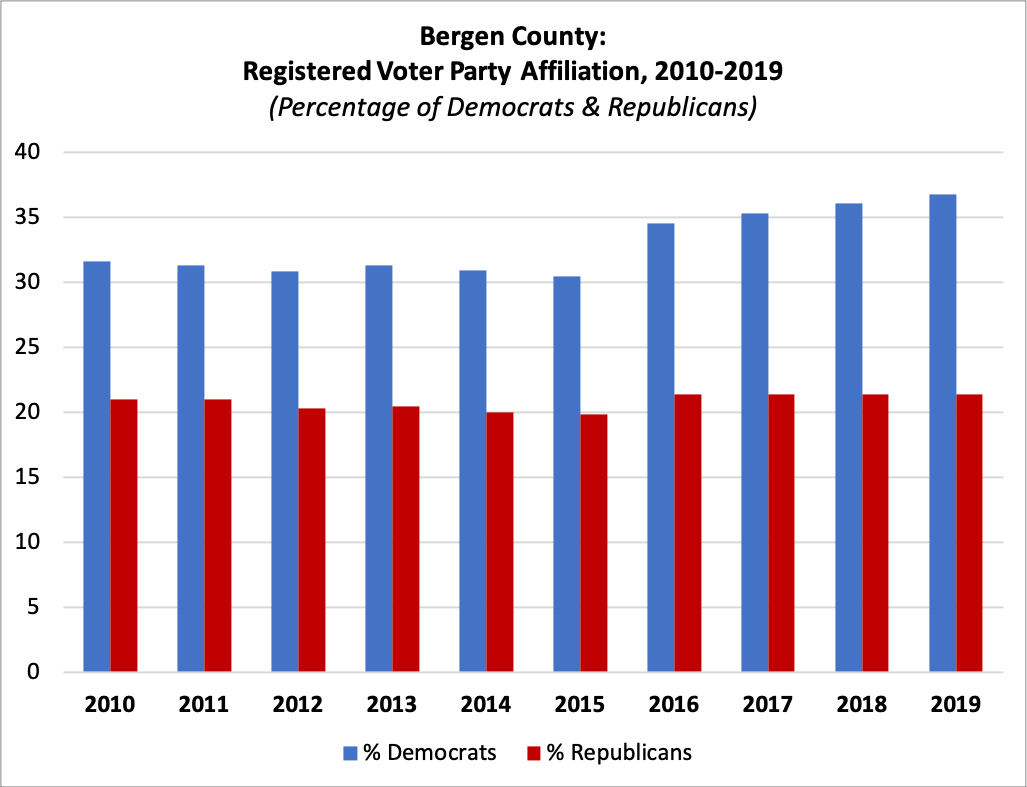
Percent Registered as Democrats
| 2010 | 31.60% |
| 2011 | 31.33% |
| 2012 | 30.84% |
| 2013 | 31.30% |
| 2014 | 30.89% |
| 2015 | 30.42% |
| 2016 | 34.53% |
| 2017 | 35.30% |
| 2018 | 36.11% |
| 2019 | 36.75% |
Percent Registered as Republicans
| 2010 | 21.00% |
| 2011 | 20.96% |
| 2012 | 20.30% |
| 2013 | 20.45% |
| 2014 | 20.01% |
| 2015 | 19.82% |
| 2016 | 21.39% |
| 2017 | 21.38% |
| 2018 | 21.35% |
| 2019 | 21.41% |
For this and more data, visit njdatabook.rutgers.edu!
References
1. Discovering History. Bergen County, NJ Official Website. Retrieved from https://www.co.bergen.nj.us/discovering-history/about-discovering-history.